Last Updated: June 9, 2021
What is the Google Lighthouse report?
Google Lighthouse is an open-source tool that runs technical audits of URLs to improve your site holistically across 5 categories: web accessibility, best practices, web performance, search engine optimization, and progressive web applications. Users can audit their URLs for some or all of the 5 aforementioned categories. Altogether, it gives you a great overview of the quality and performance of your site on desktop, mobile, and web applications.
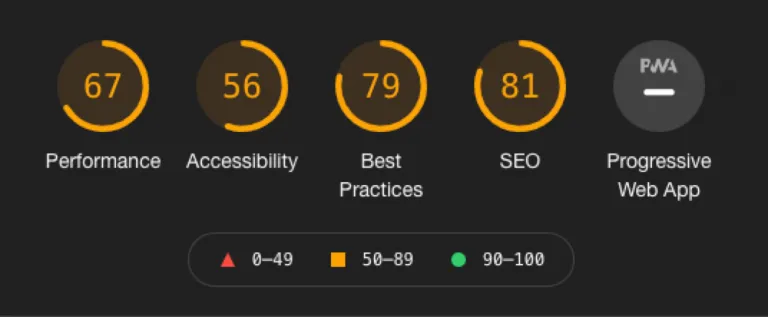
Notably, the latest version of Google Lighthouse (Lighthouse 6/7) includes the measurement of Core Web Vitals (CWV) with the launch of a series of Google algorithm "Page Experience" updates beginning in June 2021. The Page Experience update makes the CWVs new speed ranking factors which will become increasingly more impactful throughout the summer of 2021.
To go along with the Page Experience rollout, Google has also updated their Google Lighthouse Tool to reflect exactly how we should be thinking about page performance and which speed factors are the most important to provide a good user experience and to rank well in Google Search Results. The latest version of this tool is called Google Lighthouse 8.0 and launched June 1st, 2021.
This is huge because age experience is becoming more important to search engines and users alike. Remember, site speed isn’t just about how fast your pages load. It’s also about perception — it must feel fast. Just the perception of a slow site can have devastating effects on conversion rates. Shaving milliseconds of time offloading can make a world of difference. And this is where Lighthouse is particularly useful from a technical SEO standpoint. These audits take a very practical approach — simulating the experience of a real-world user visiting your site on an underpowered device with a 3G connection — to give developers, SEO Analysts, and webmasters the data and recommendations they need to improve performance.
How does the Google Lighthouse report work?
Users can only use Google Lighthouse report at the individual URL level right now. It works by collecting data from the browser, calculates scores, and then generates reports for the requested categories. The scores are based on a 1 to 100 point scale. And within each category, you can expand the section to see the explanation of the score, along with tips for improvement.
To test multiple pages of your site, identify major page types (like your homepage), goal conversion points (like a demo signup page), common templates (like a calculator or other tool page), and run reports on each of these sample URLs. Save the data and to-do list of improvements that can be applied to these pages and other similar ones.
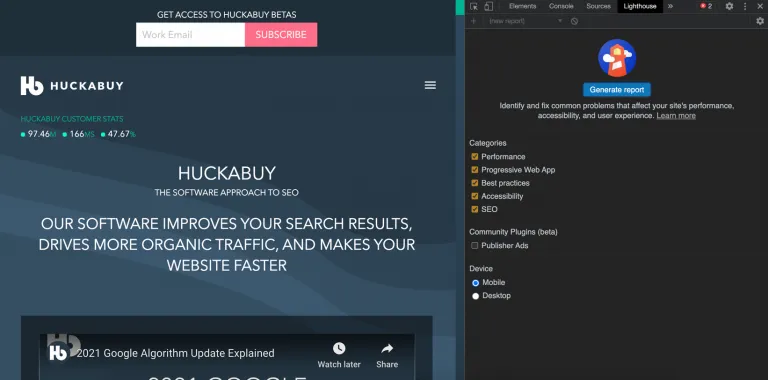
Google Lighthouse audits can be run in Chrome Dev5Tools, through the Google Chrome plugin, a command line, or as a Node module. Note that when users run Lighthouse, the audits it generates uses lab data with a predefined device and network settings. As mentioned earlier, Google assumes the majority of users don’t have access to high-powered devices and fast 4G or 5G connections, so they simulate conditions of a user with a poor device and 3G connection. To mirror that experience on your own device when running the audit, open your Chrome browser in incognito mode, open the network panel, check the box to disable the cache, and click “generate report” in the Lighthouse panel.
What are the features of Lighthouse?
There are 5 possible categories audited in a Lighthouse report. This article looks at just one section in particular: the website performance section.
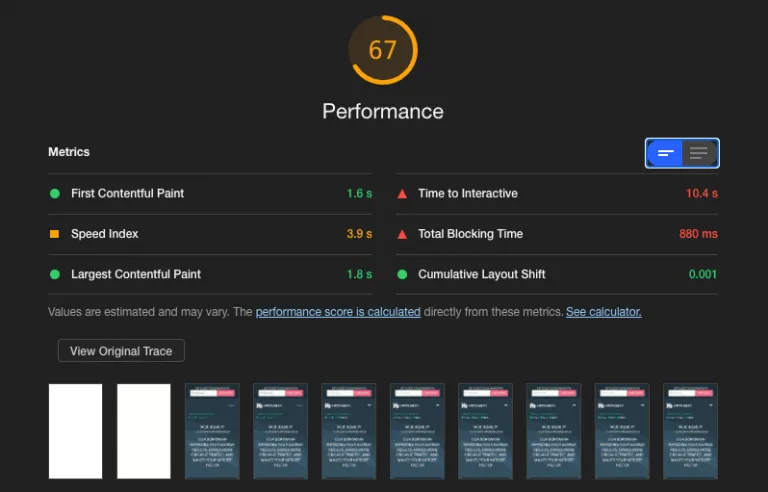
In the performance section, Lighthouse looks at how quickly users can view and access page content based on 6 performance metrics including the new Core Web Vitals:
- First Contentful Paint — measures the time until the first text or image becomes visible.
- Largest Contentful Paint— one of the new Core Web Vitals — measures the time until the main content of a page becomes visible to users.
- Speed Index — measures how quickly the content of a page is loaded.
- Time to Interactive — measures the time until the user is able to fully interact with page content.
- Cumulative Layout Shift— one of the new Core Web Vitals — measures the visual stability of the page as it loads.
- Total Blocking Time,a proxy for First Input Delay— one of the new Core Web Vitals, which measures me between First Contentful Paint and Time to Interactive where blockages happen that hinder responsiveness.
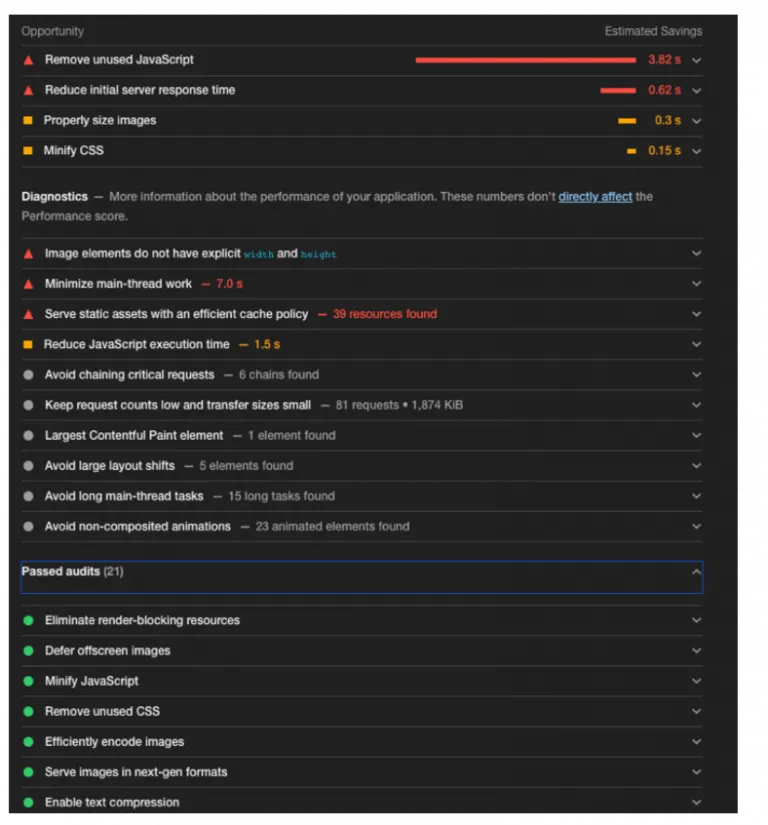
The performance section expands on these metrics with recommendations for improvements like compressing images, cleaning up Javascript and CSS, and reducing render blocking resources to reduce load time - among many other tips.
Performance Metrics Weighted Breakdown
Below is a breakdown of how the Google Lighthouse Performance Score is weighted and how the weighted breakdown has changed between Lighthouse 6/7 and Lighthouse 8. Given the importance of the upcoming June 2021 Google algorithm update — which introduces new ranking signals to measure real user page experience — we are interested in how the three new Core Web Vitals influence the performance score for URLs. How well a website scores on the Core Web Vitals heavily influences the overall web performance as they make up 55% of Lighthouse’s weighted performance score.
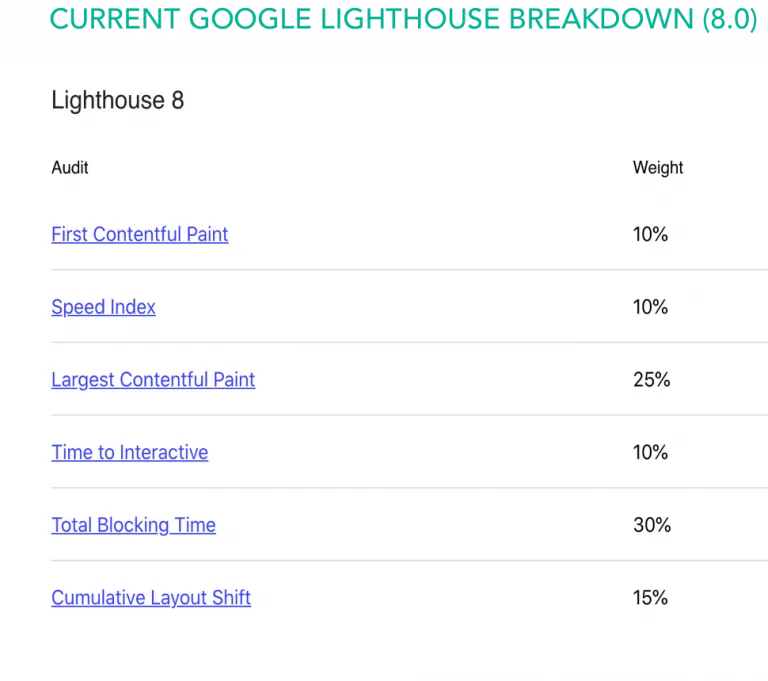
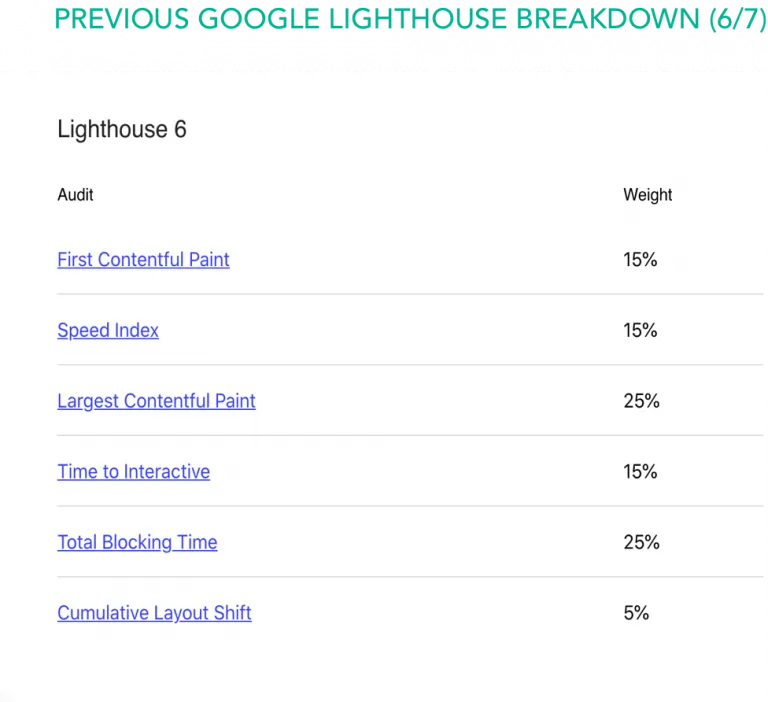
Performance Scoring Calculator
What’s cool is you can open up the Lighthouse scoring calculator to see how each metric is calculated and toggle the scores for each metric to see how applicable changes would impact your overall score. Also, if you are accessing this report through Chrome DevTools, you can define or see each of these metrics in action.

How to Define scoring metrics in Chrome DevTools
- To define Largest Contentful Paint, simply hover over the LCP marker in the timings section. The element that corresponds to LCP is detailed in the related node field.
- To define Cumulative Layout Shift, simply hover from left to right over the screenshots of the load. Observe elements bouncing after first paint to identify causes of CLS.
- To observe Total Blocking Time (proxy for First Input Delay), click the reload button to start a performance trace and look for red markers in the upper right corner of tasks, which indicates processes that took longer than 50 milliseconds.
Why does Google Lighthouse matter for technical SEO?
This is a useful technical SEO tool because it highlights performance issues — taking into account the importance of the new Core Web Vitals metrics — and provides solid recommendations on what you can do about them. Furthermore, because this report carries the authority of Google and recommendations are prioritized based on the potential impact on site performance, it can be more convincing to development teams that may be in charge of making the necessary changes. Finally, while the SEO report looks at fairly standard metrics like how well a website can be crawled by search engines and displayed in search results, there are helpful recommendations here too including tips for mobile-friendliness, correct application of structured data, and optimizations for canonical and title tags.
