A Google algorithm update is a change made to Google’s search engine in order to improve the quality, relevance, and overall user experience of its search results.
WANT TO GROW YOUR ORGANIC SEARCH CHANNEL? SCHEDULE YOUR DEMO NOW.
DOES YOUR WEBSITE STACK UP?
Published: August 4, 2021
Last Updated: December 2, 2021
Author: Lindsey Nelson
THE JUNE-AUGUST 2021 GOOGLE ALGORITHM UPDATE
On June 16th, 2021, Google began to roll out a broad core algorithm update called "The Page Experience Update."¹ This update is intended to bring a better experience to users by prioritizing pages that offer a quality page performance — ie fast load times, and a non-shifting, stable page. Google has always had some page experience metrics — mobile-friendliness,² HTTPS-security,³ and intrusive interstitials⁴ — and they have prioritized fast pages since 2010,⁵ but with the 2021 Page Experience update, they are now introducing three new metrics to measure both speed and overall page experience. These new metrics are called Core Web Vitals.
Enhance your website nowTABLE OF CONTENTS:
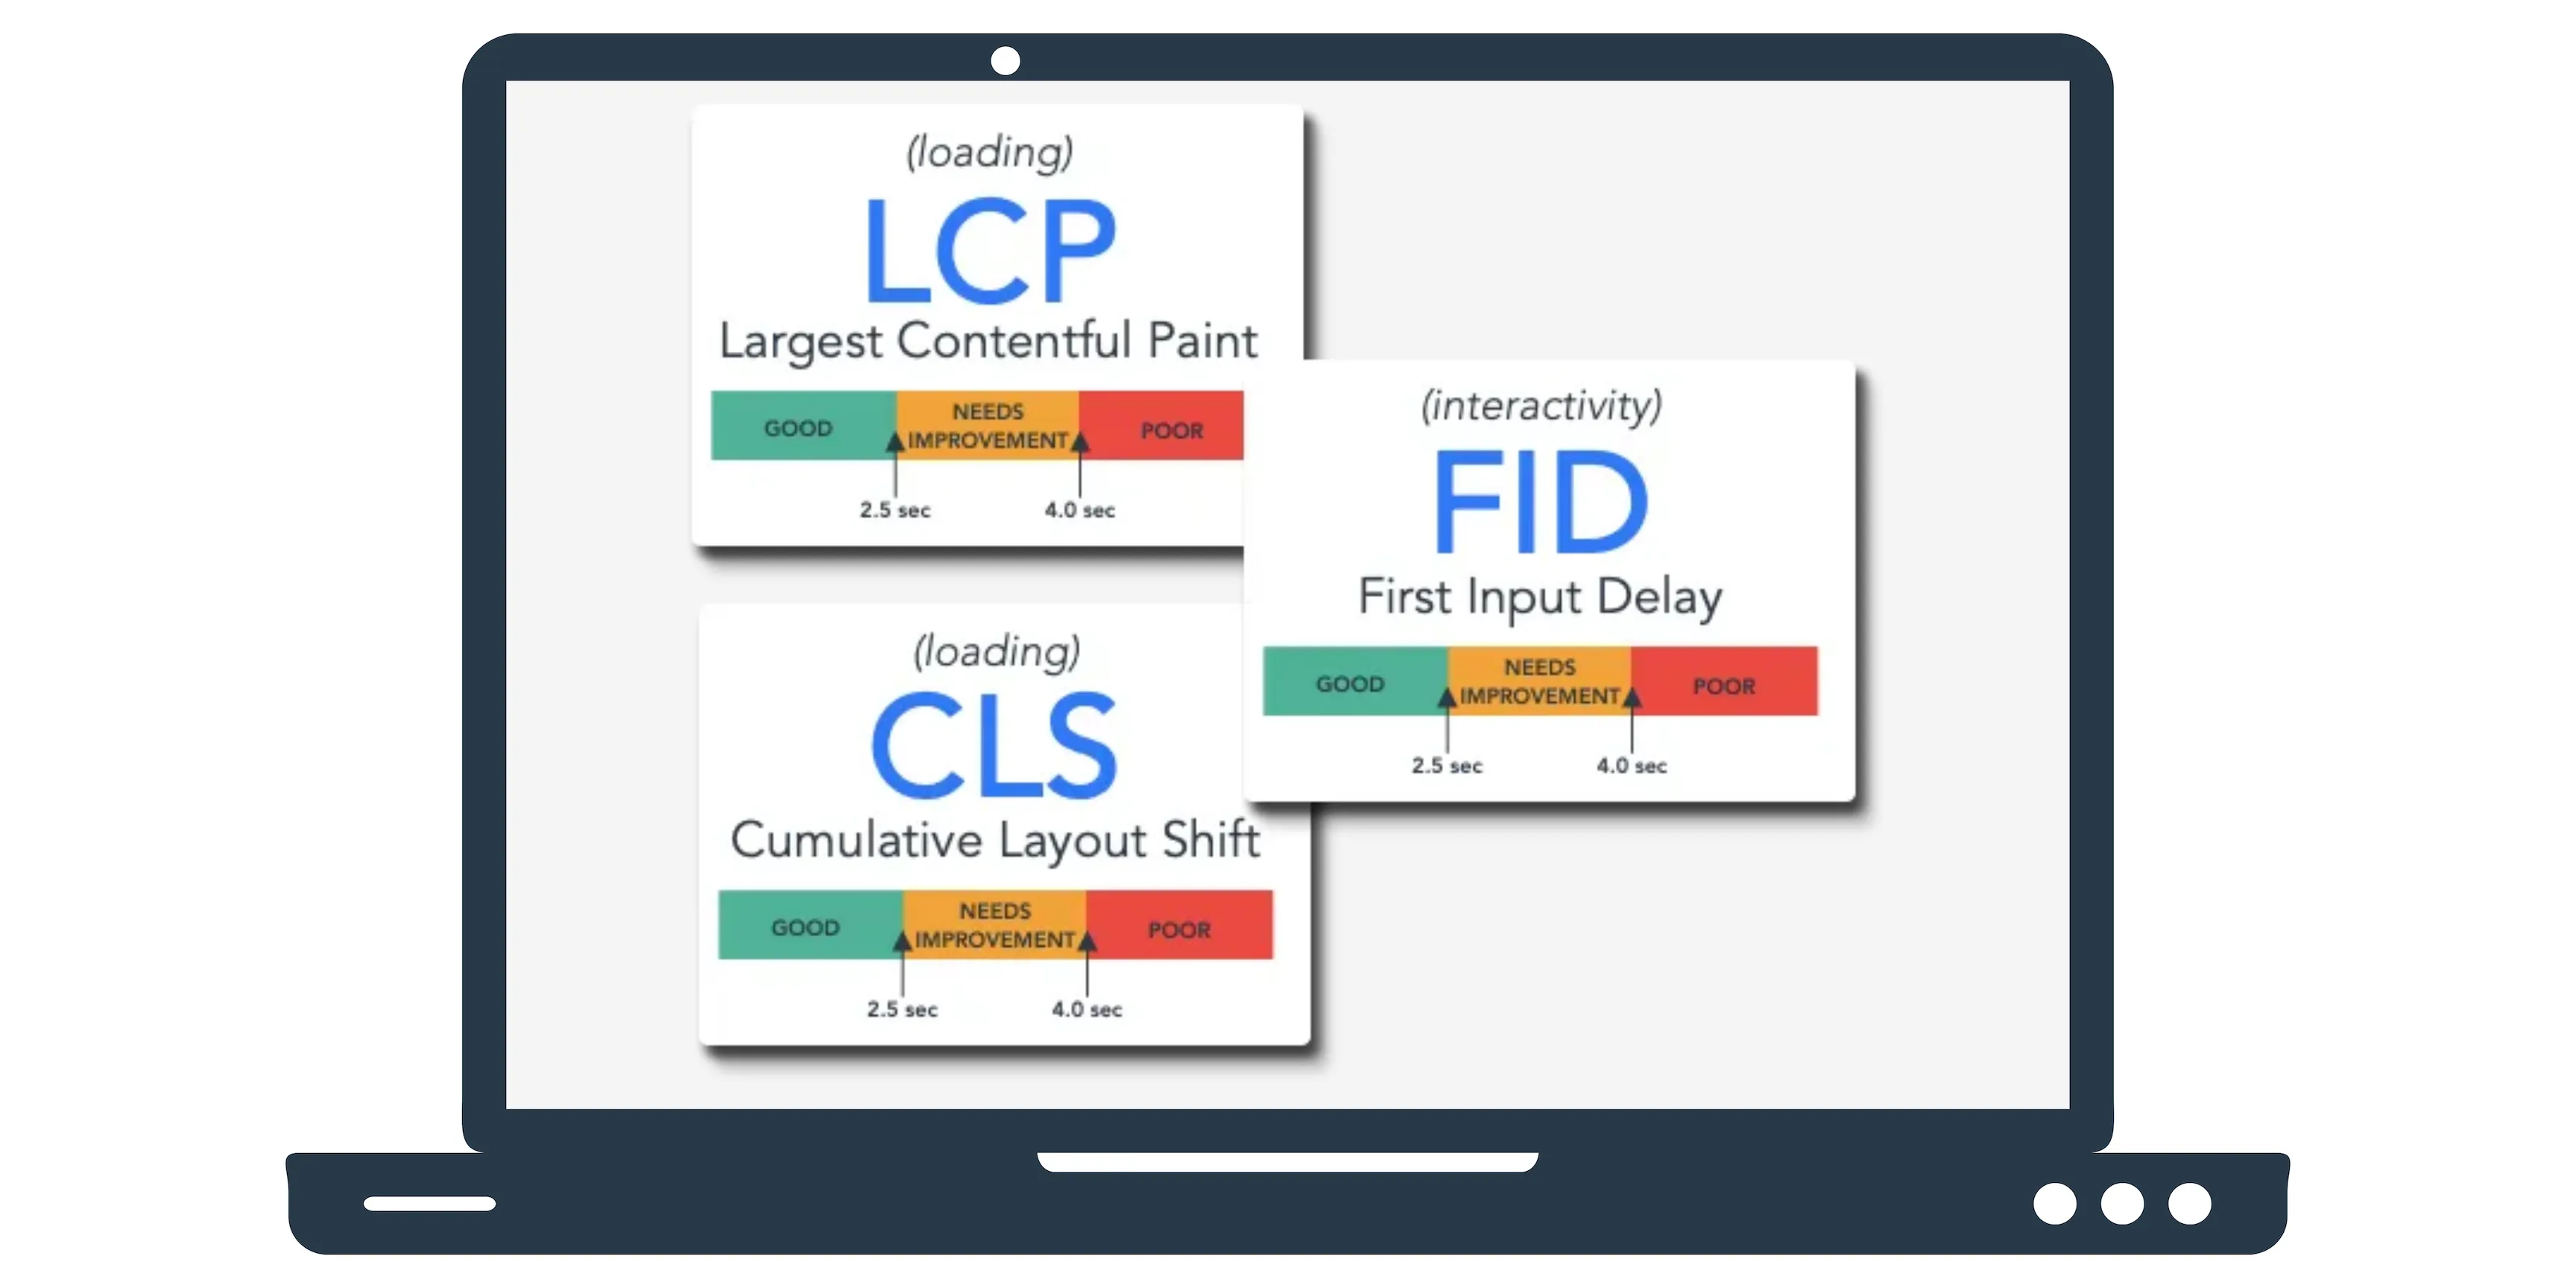
What are the Core Web Vitals?
The new Core Web Vitals include largest contentful paint (LCP), first input delay (FID), and cumulative layout shift (CLS). In addition to serving as lightweight ranking signals, these new metrics will help website owners monitor and improve the loading speed, responsiveness, and stability of their websites to ultimately build a better user experience (UX).
OVERVIEW OF THE THREE CORE WEB VITALS
LARGEST CONTENTFUL PAINT (LCP):
LCP: The first metric, largest contentful paint measures how a user perceives the initial load of a page — it measures the visual part of the load time. More specifically, LCP measures the time it takes for the largest block of visual content on a page to load.

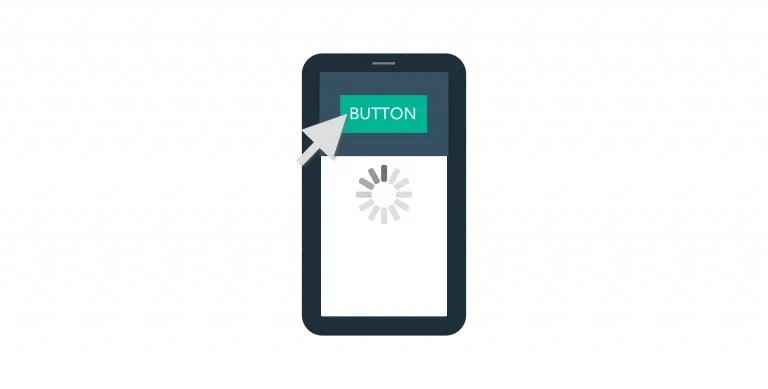
FIRST INPUT DELAY (FID)
Next, we have the* first input delay* metric. This measures how fast it takes for a page to become responsive. If you’ve ever tried to click something on a web page (like a button), and it takes a sec to respond, that means it has a slower FID.
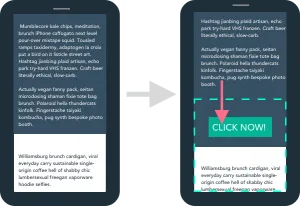
CUMULATIVE LAYOUT SHIFT (CLS)
The final metric in the Core Web Vitals is cumulative layout shift This metric measures page stability. For example, if you’ve been in the middle of reading an article and the page shifts, you have to find your place in the article again. That annoying shift is called a page layout shift. The cumulative layout shift is the overall shift in a page's layout as it loads.
The cumulative layout shift metric has changed⁶ since the Core Web Vitals were first announced in May 2020. Google has a complicated process for calculating the best way to measure CLS, and their initial research was based on a large-scale analysis of several websites. Even so, when webmasters and developers began to make adjustments to improve their CLS scores, the positive changes they were making were negatively impacting in some cases. Google adjusted the CLS metric to account for this problem by changing the way they collect the data to determine the CLS measurement.
IMPROVE MY SITES STABILITYHOW GOOGLE'S PAGE EXPERIENCE UPDATE IMPACTS SEO
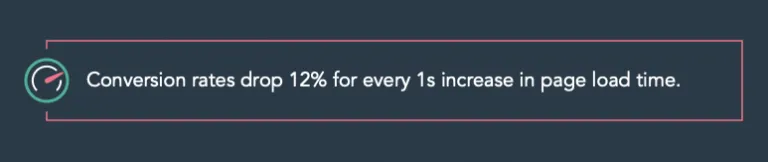
From an SEO standpoint, there is an incentive to optimize your website for good Core Web Vitals scores because they will become a lightweight ranking factor. Additionally, a good user experience improves bounce rates, conversion rates, and ultimately, revenue, across all marketing channels. Users typically decide whether or not they want to stay on your website within the first 10-15 seconds of arriving, and if your site performance isn't up-to-speed. Users will be more likely to navigate elsewhere.
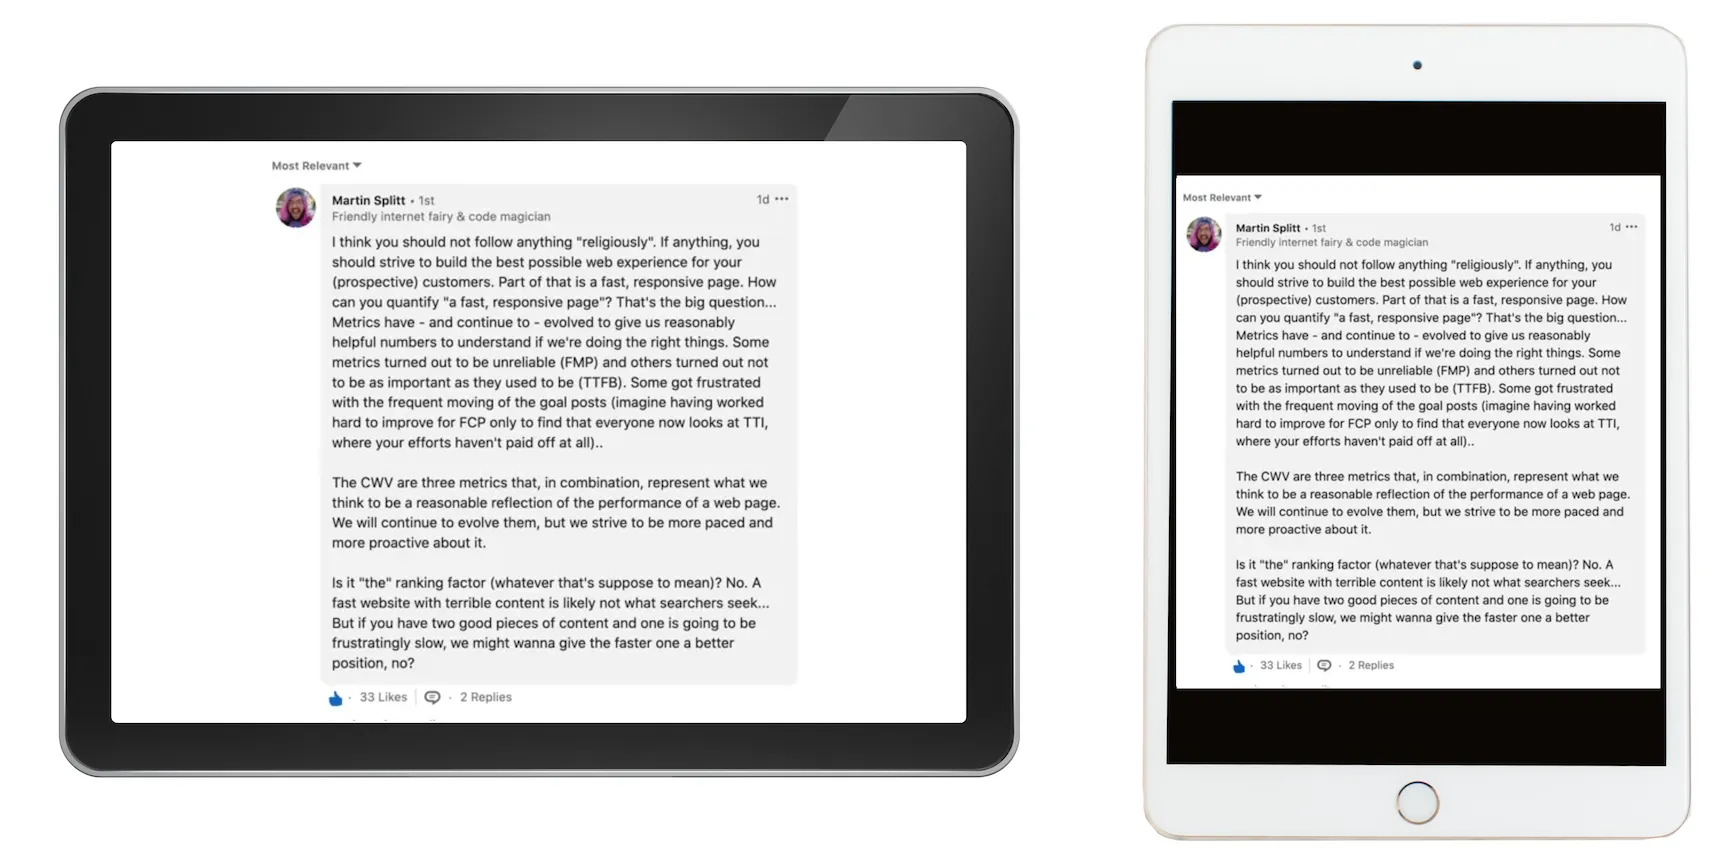
Improving page experience should be about increasing your overall webpage quality. This means you don’t want to abandon quality content creation efforts or other UX practices in the process of optimizing for this update. As Google’s Martin Splitt said:
"“Is it the ranking factor (whatever that’s supposed to mean)? No. A fast website with terrible content is likely not what searchers seek… But if you have two good pieces of content and one is going to be frustratingly slow, we might wanna give the faster one a better position, no?”"
- Martin Splitt
We've run over 10,000 Google speed tests on a variety of websites, and most sites score below 50/100 on Google Lighthouse. Part of the reason Google is emphasizing the importance of Page Experience is that most sites need to improve. As more people begin to bring up their page speed, users will see an overall improvement in their web surfing experience. Additionally, the search engine results pages (SERPs) will likely be more competitive in terms of site performance.
I WANT TO INCREASE MY SITE SPEEDHOW TO MEASURE, MONITOR, AND FIX CORE WEB VITALS
Core Web Vitals scores are calculated based on field data from the Chrome User Experience report. With that said, there is additional worthwhile lab data to reference on the journey to improving Largest Contentful Paint, First Input Delay, and Cumulative Layout Shift scores. We will look at both data in this section, and also discuss Google tools and reports you can easily access and use to measure, monitor, and fix these scores on your website.
FIELD DATA
One of the key points about Core Web Vitals is that they are based on field metrics or real user metrics (RUM). Google uses anonymous data from Chrome users for feedback, which informs the Chrome User Experience report (crUX). This data is shown in both the Pagespeed Insights tool and the Core Web Vitals report in Search Console.
The Chrome User Experience report is based on page views. This means your most popular pages will have a large influence on your data. This also explains why there may be a notification of insufficient data shown in the PageSpeed Insights report for certain websites, particularly ones with low traffic.
Also, field data that populates in the Core Web Vitals report is slow to update after changes are made because they are based on the last 28 days of data in the Chrome User Experience Report, and more specifically, the 75th percentile of those scores for the more accurate reflection of site performance.
LAB DATA
Lab data comes from tools, like Google Lighthouse, that load pages in a simulated environment on controlled network settings and devices without user input. This means it isn’t always reflective of the user experience. First Input Delay, for example, cannot be measured in this environment. However, this data is still instructive and can give you a good idea if you are on the right track with optimizations. Total Blocking Time, for example, has been recognized by Google as a good lab proxy for First Input Delay.
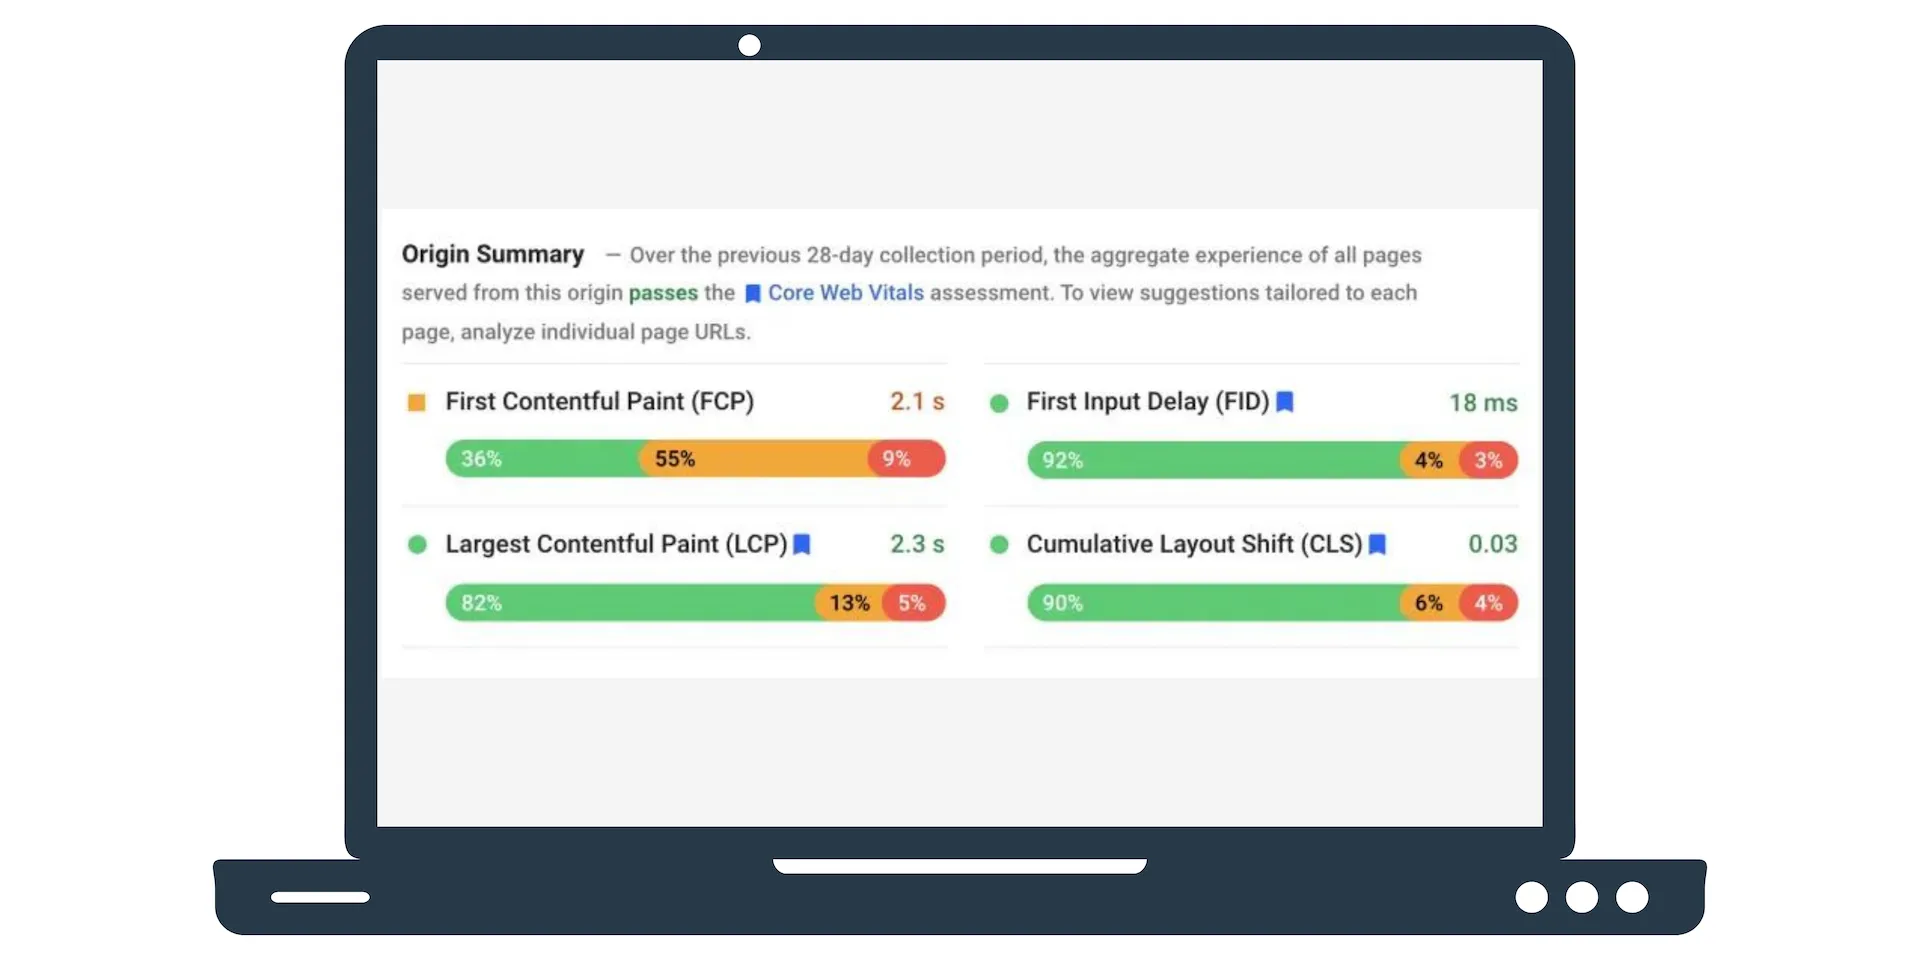
PAGESPEED INSIGHTS
The PageSpeed Insights tool shows an overall score at the top of the page which is the result of a calculation based on Lighthouse data. Directly below that score is a section on data from the Chrome User Experience Report. This shows scores for each of the three Core Web Vitals, as well as First Contentful Paint. There is also a note stating whether the URL passes the Core Web Vitals assessment based on data from the previous 28 day collection period.
When testing a URL, you may see the alert that “The Chrome User Experience Report does not have sufficient real-world speed data for this page.” This is because Google collects anonymized data for the report and there must be enough page loads to report for sufficient data collection.
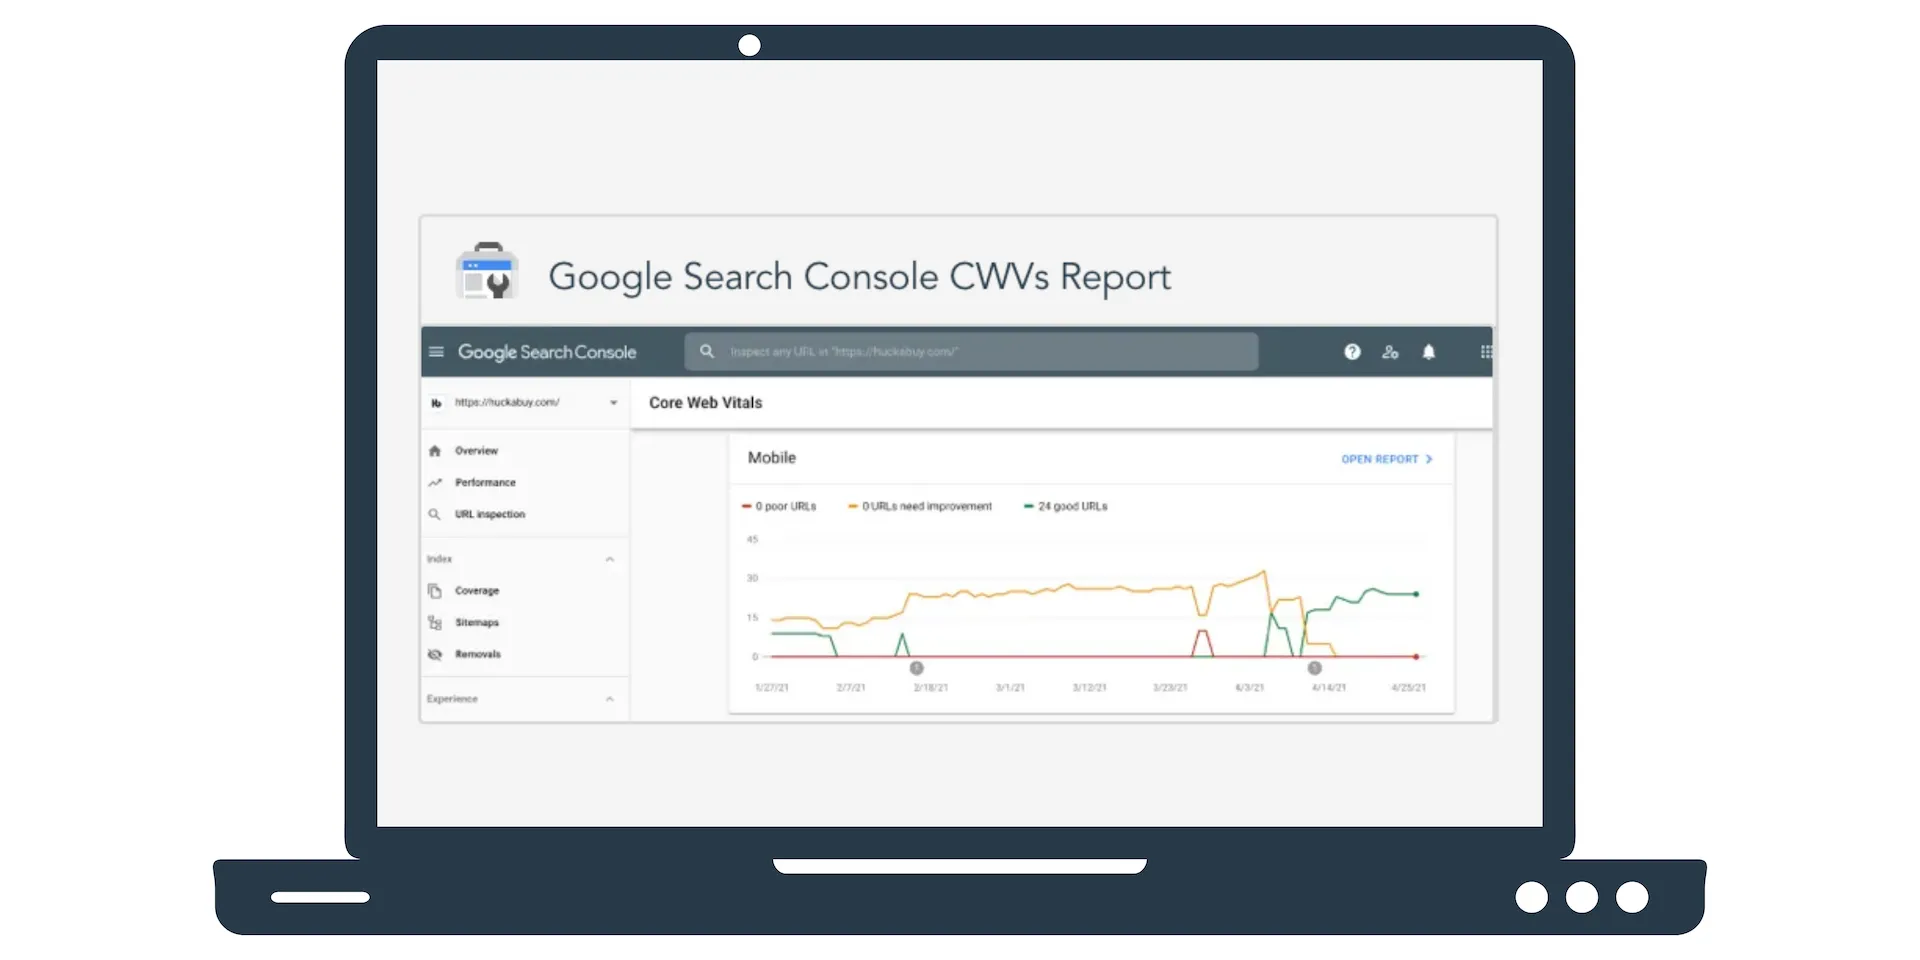
CORE WEB VITALS REPORT
The Core Web Vitals report shows how your pages perform for each of the three metrics based on real-world usage data. URLs are grouped together by performance status (“poor”, “needs improvement”, and “good”) for Largest Contentful Paint, First Input Delay, and Cumulative Layout Shift on mobile and desktop. After reviewing this report, you are able to make page updates. Once those edits have been made, you can “validate these fixes” in the report. This starts a new 28-day monitoring session. Until then, you will see a “pending” status in your report for the particular fixes. After the 28-day session, you will either see a “passing” or “failing” status.
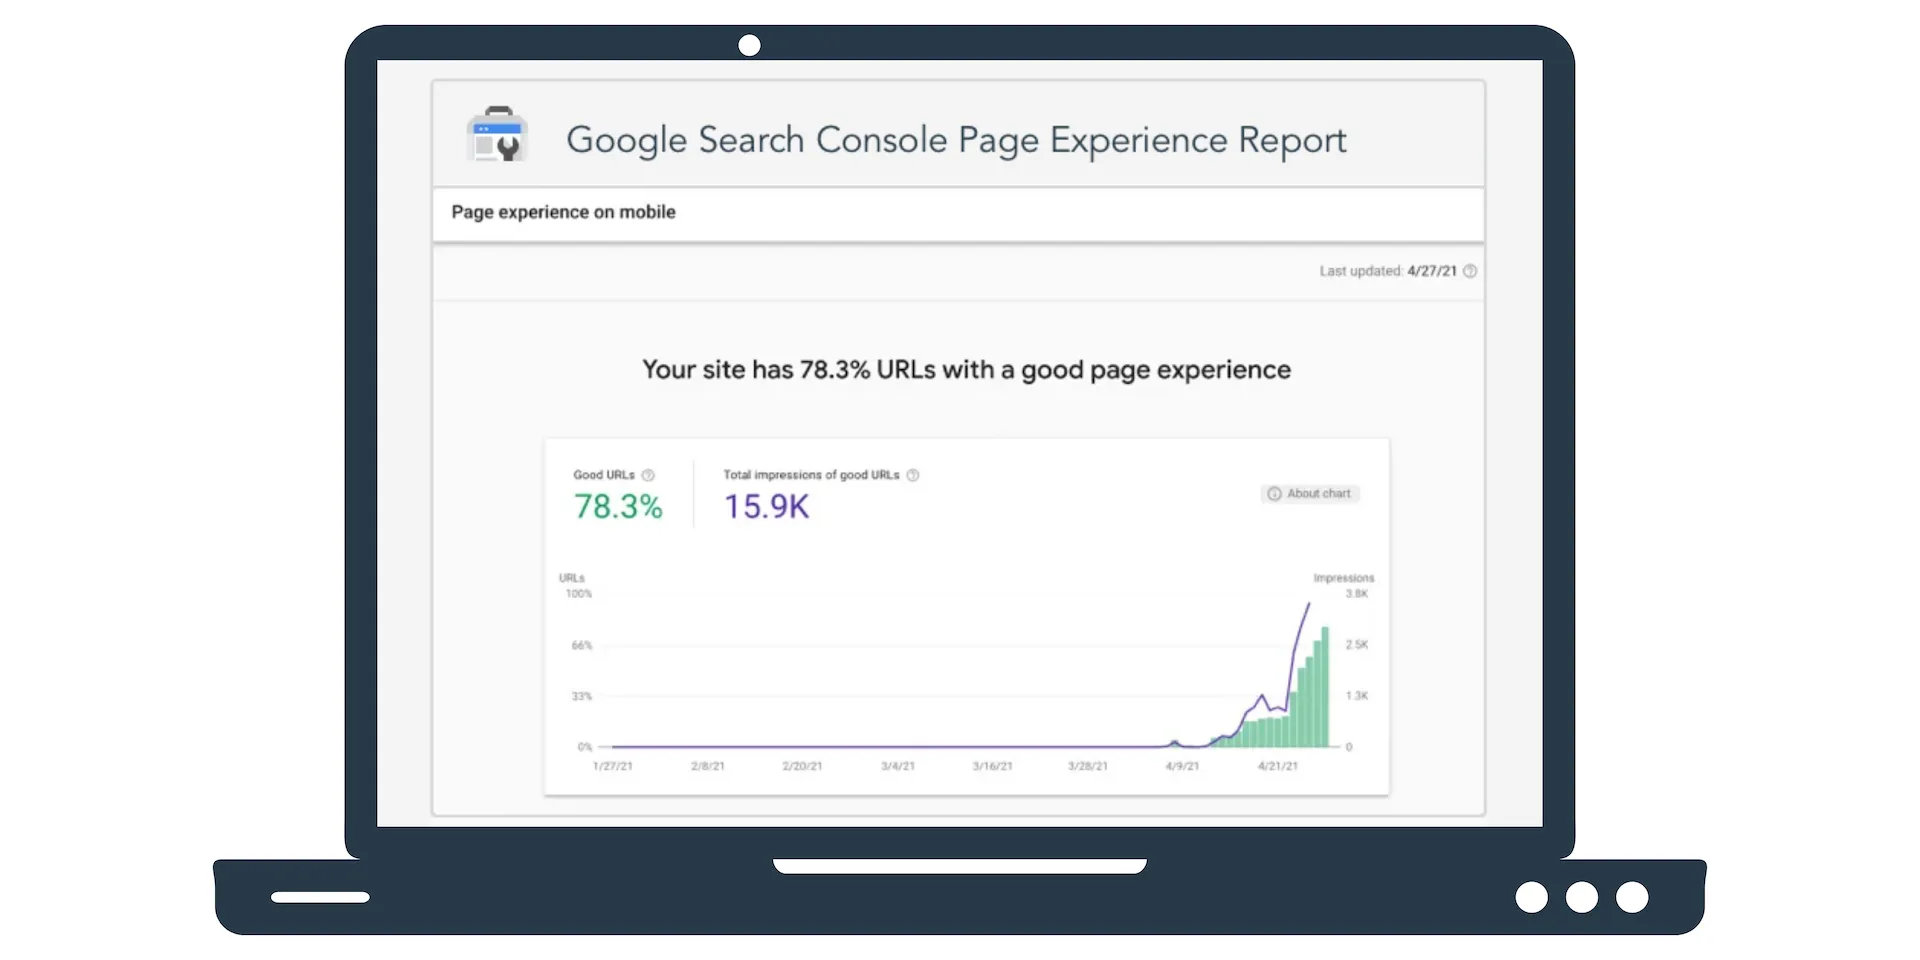
PAGE EXPERIENCE REPORT
The Page Experience report is a new Google report that shows data on each of the page experience metrics over the previous 90 days. Specifically the percentage of URLs on your site that provide a “good” page experience and the number of impressions those URLs have received in organic search results. For a URL to have a “good” page experience, it must pass the Core Web Vitals assessment and there must be no issues associated with mobile usability, security, HTTPS, or advertising experience.
THE PAGE EXPERIENCE UPDATE IMPACT ON CONVERSIONS AND REVENUE
Google and_industry research⁷ ⁸ indicate that there is a strong correlation between good user experience and conversions. For example:
- Pages that loaded in 2.4 seconds had a 1.9% conversion rate
- At 3.3 seconds, conversion rate was 1.5%
- At 4.2 seconds, conversion rate was less than 1%
- At 5.7+ seconds, conversion rate was 0.6%
Longer page load times have a severe effect on bounce rates.⁹ For example:
- If page load time increases from 1 second to 3 seconds, bounce rate increases 32%
- If page load time increases from 1 second to 6 seconds, bounce rate increases by 106%
For the relationship between first contentful paint and reveue:
- On mobile, per session, users who experienced fast rendering times bring 75% more revenue than average and 327% more revenue than slow.
- On desktop, per session, users who experienced fast rendering times bring 212% more revenue than average and 572% more revenue than slow (ALDO Case Study).¹⁰
Here's a comment from Google on the reason for this page experience update:
"“Providing a smooth journey for users is one of the most effective ways to grow online traffic and web-based businesses. We hope the Web Vitals metrics and thresholds will provide publishers, developers and business owners with clear and actionable ways to make their sites part of fast, interruption-free journeys for more users.”"
- Google
This page experience update will make it even harder for sites with poor user experience to rank highly and get traffic from the search results that matter most to their business. As previously mentioned, Google will be adding a badge directly in search results to sites with good user experience. It will be interesting to see how users respond and whether they will be more likely to bypass or ignore sites without this endorsement.
IMPROVE MY CORE WEB VITALS SCORE"We believe that providing information about the quality of a web pages experience can be helpful to users in choosing the search result that they want to visit. On results, the snippet or image preview helps provide topical context for users to know what information a page can provide. Visual indicators on the results are another way to do the same, and we are working on one that identifies pages that have met all of the page experience criteria. We plan to test this soon and if the testing is successful, it will launch in June 2021 and we will share more details on the progress of this in the coming months."
- Google Search Central
HOW TO IMPROVE CORE WEB VITALS SCORES
It should be noted that improving your Core Web Vitals requires technical chops. If you are not a developer yourself, consider assigning responsibility for these scores to a developer on your team, outsourcing the work to SEO experts, or using software designed to improve these metrics.
The first thing you should do is understand the problems specific to your site. Perhaps, for example, your site is scoring well on Cumulative Layout Shift, but you have a lot of room for improvement on First Input Delay and Largest Contentful Paint. Run a quick audit of your site through Page Speed Insights or Lighthouse to see where you stand on all three and what strategies are suggested for improvement. Now you can dive into the Core Web Vitals report in Search Console to see which specific URLs need to be fixed.
If you are scoring in the “green” on all three metrics and therefore passing the Core Web Vitals assessment, simply continue to monitor these numbers on a weekly basis in the lead-up to the update. Unless you are reliant on software, achieving good page speed is not usually a “set it and forget it” type endeavor. It requires vigilance._
If you are scoring in the “orange” or “red” on any of the three metrics and therefore failing the Core Web Vitals assessment, dive into the recommended suggestions for improving each score and open up that Core Web Vitals report to identify which URLs need to be fixed. Of course, you could simply use Huckabuy Page Speed software to solve the problem. That said, in future articles, we will detail exactly how to improve Largest Contentful Paint, First Input Delay, and Cumulative Layout Shift scores if you want to approach this problem with developer time and resources.
How can page speed boost your site?
THE AVERAGE CUSTOMER SEES A 20-40 POINT SPEED SCORE INCREASE (OFTEN MORE). YOU COULD AUTOMATICALLY BOOST YOUR SITE, TOO.
Sources
GOOGLE ALGORITHM UPDATE NEWS AND RESOURCES
Frequently Asked Questions
-
-
A core algorithm update is one that is so significant to the algorithm, that Google is compelled to publicly announce the pending changes, usually well ahead of time to give webmasters sufficient time and opportunity to adjust. The June 2021 “Page Experience” update is an example of a “core” algorithm update.
-
Google updates its algorithm quite often. Sometimes thousands of times per year. But most of these changes go unnoticed. Typically, when a significant change is made, Google makes a public announcement well ahead of time.
-
The latest (publicly acknowledged) algorithm update is the “Page Experience” update, which introduced new ranking factors tied to the quality of a site’s user experience (loading speed, responsiveness, and visual stability). The rollout for this update began in mid-June 2021 and is expected to be complete by the end of the summer.
-
The Google Core Web Vitals update is a core algorithm update that began to roll out on June 16th, 2021. It will introduce three new metrics into the algorithm that measure and help rank sites based on the quality of their user experience. Specifically, they look at how quickly the largest piece of content in the initial viewport loads, how responsive the page is, and how visually stable the page is. The three metrics that make up the Core Web Vitals are called Largest Contentful Paint, First Input Delay, and Cumulative Layout Shift.
-
Core Web Vitals are important primarily because they are set to become a new ranking factor in Google’s search algorithm in 2021. They are also important because they measure the quality of a site’s user experience, which is important for all marketing channels and has a big impact on key metrics like bounce rates, conversions rate, and revenue.
-
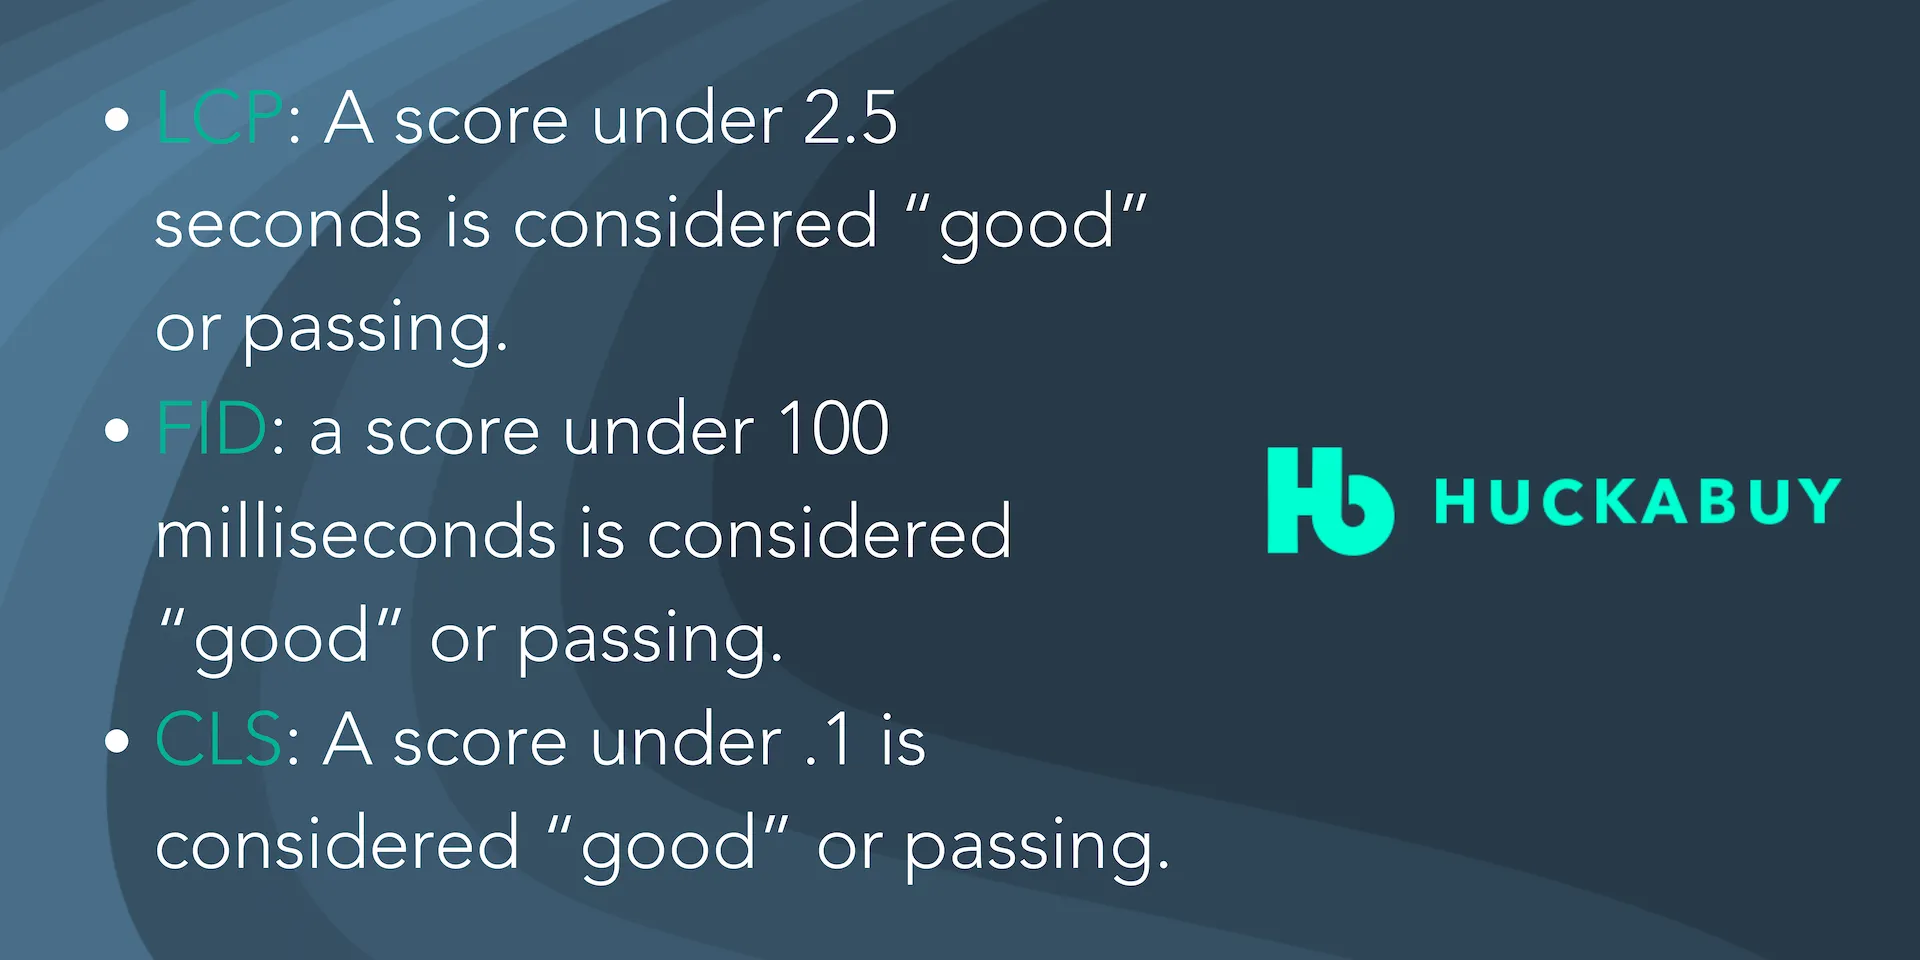
In order to pass a Core Web Vitals assessment, your web page must receive a passing score for each of the metrics. For the Largest Contentful Paint, you must be under 2.5 seconds. For First Input Delay, you must be under 100 milliseconds. And for Cumulative Layout Shift, you must be under 0.1.
-
There are numerous tools and reports that can be used to monitor and measure your website’s Core Web Vitals. We recommend using any of the following: Google’s PageSpeed Insights tool and both the Core Web Vitals and Page Experience reports in Google Search Console. All three of these tools use real-world user data to collect information about the experience your site provides to users over about a 30 day period. In order to troubleshoot fixes to your website for Core Web Vitals, we recommend using Google Lighthouse. This tool gives you an estimate of how your web page will perform for the average user by using a controlled testing environment.
- Search Engine JournalGoogle Rolls Out New Spam Algorithm UpdateGoogle confirms rollout of a spam-related algorithm update on October 19, 2022.Huckabuy CommentStaying up-to-date on Google's Algorithm Updates is always essential-- even when it's something seemingly small. Google's newest spam update means that any site marked...Read More
- Search Engine RoundtableGoogle Search Ranking Algorithm Update November 4th and 5th -- UnconfirmedThe update seems pretty significant, with a nice amount of chatter and the tracking tools, at least most of them, showing big spikes on the 4th and 5th of November.Huckabuy CommentSEO expert Barry Schwartz writes about the new signals of a possible Google search ranking algorithm update. While Google has not yet confirmed the...
- seroundtable.comGoogle Helpful Content Update Movement? Yes But Not Widespread.There seems to be a lot of confusion around the Google helpful content update and if it is "big" or not big. That all depends on if you were hit by it, if you were, oh boy is it really big for you. But in terms of how widespread it is, so far, it is not affecting many many sites.Huckabuy CommentAre you seeing serious movement with the Google Helpful Content Update? It seems as if it didn't spread too far beyond the most unhelpful...
- seroundtable.comGoogle: API Not Impacted By Search Console Indexing Label BugLast week it was reported that Google Search Console had an embarrassing bug where it was reporting pages as being indexed, when those pages were not indexed by Google Search.Huckabuy CommentThe URL Inspection tool API was not impacted by the Google Search Console bug last week. as confirmed by Google.
- seroundtable.comGoogle May 2022 Core Update - Big Tremors After It Was Complete?As you remember, the Google May 2022 core update officially started on May 25th and officially ended on June 9th. But like we said initially, we felt it started or was being tested, before May 25th and now, it seems like there are more tremors, big tremors, for some sites.Huckabuy CommentHave you seen an increase in international traffic or an overall decrease in traffic? This could be Google's latest update at play. A large...
- seroundtable.comApril 2022 Google Search Ranking Algorithm UpdateIt's a possibility there was a Google search ranking algorithm update on April 18, 2022. There is limited chatter, but the tracking tools are showing volatility on and around April 18th. The last confirmed update was the March 2022 Product Reviews Update.Huckabuy CommentThere is current speculation that Google updated the search ranking algorithm this month. The tracking tools are now picking up volatility with Google's search...
- Search Engine LandGoogle Releases March 2022 Product Reviews UpdateGoogle releases March 2022 product reviews update with additional ranking criteria. Google has begun the rollout of the third version of the products reviews update, a search ranking algorithm update targeted at ranking product review related content on the web that is most help.Huckabuy CommentGoogle is rolling out an updated search ranking algorithm update with new criteria for product reviews. Reviews are now anticipated to include helpful in-depth...
- seroundtable.comSpring 2022 Google Search Ranking Algorithm UpdateGoogle may have started to release another Google search ranking algorithm update starting Friday, March 18th through today, March 20th. This is an unconfirmed update but unlike the last one we reported, we have both chatter from the SEO community and also the tracking tools areHuckabuy CommentThere is speculation that Google might be moving on an unconfirmed algorithm update this spring of 2022. Danny Sullivan said he didn't know of...
- Search Engine Journal10 Advanced SEO Tips & Techniques You Need To KnowAs Google continues to update its algorithm to provide searchers with the best user experience possible, SEO professionals must also update their techniques to stay competitive. Update your search engine optimization strategy with these 10 advanced SEO tips and techniques.Huckabuy CommentAs search engines evolve SEOs need to evolve. Now more than ever SEOs need to have a broader understanding of how their website is...
- Search Engine JournalGoogle December 2021 Product Review UpdateGoogle announces the launch of the December 2021 Product Review Update, which will take three weeks to complete. Happy Holidays or bad timing?Roger MonttiDecember 1, 20214 min readSEJ STAFF Roger MonttiOwner at Martinibuster.comBioFollow / December 1, 2021 / 4 min read163SHARES3.Huckabuy CommentGoogle announced that there will be a update to product reviews. This update will take about 3 weeks to rollout. Read this article for...
- TwitterSEO News: November 2021 Core UpdateThe November 2021 Core Update rollout is now complete.On November 17th, Google announced via Twitter that they were beginning the rollout of a routine core algorithm update. On November 30th, they announced that the update was complete. This update didn't require any specific action from webmasters other than to continue to uphold quality standards. That said, if you see a drop in rankings, this could be the culprit.Huckabuy Comment
- Niel PatelHow to Hack Google: The Ultimate Google Algorithm Cheat SheetThe Google algorithm is constantly evolving, which can cause a few headaches when you’re a marketer trying to retain the highest possible page ranking at all times. However, there’s good news: It’s possible to “hack” the algorithm and retain a solid Google ranking.Huckabuy CommentNeil Patel, a relevant figure within the SEO community dives into the specifics of Google’s algorithm and its updates. Patel mentions that minor changes...
- Knucklepuck MediaHow to Monitor Google Algorithm Updates: Knucklepuck’s Top TipsShare Tweet Share EmailIt’s estimated that Google makes minor changes to its search algorithm at least 500 times per year. Every tweak is made to help users find what they want more easily, meaning the search engine results pages (SERPs) are constantly changing.Huckabuy CommentKeeping up with Google's algorithm can help you maintain a successful organic channel, and failing to keep up with these changes could result in...
- Amsive DigitalGoogle November 2021 Core Update: Winners, Losers & Analysis - Amsive DigitalAnalysis by CategoryGoogle announced on November 17, 2021, that it would be launching the November Core Update, as it does several times per year.Huckabuy CommentThe November 2021 core update resulted in winners and losers in terms of SEO visibility. This article looks at the Sistrix Visibility Index scores...
-
 HuckabuyGoogle Releases November 2021 Broad Core UpdateOn November 17th, 2021 Google announced on Twitter that they would be rolling out a new Core Algorithm Update later that day. In Google's original announcement, they stated that the algorithm update would take 2 weeks to fully roll out.Huckabuy CommentGoogle has routine core update several times a year, so this update falls in line with previous core updates. If you'd like to learn...
 - Semrush BlogHow To Prepare Your Website for a Google Core Algorithm UpdateGoogle Core Algorithm Updates are to SEO, what space is to a hitchhiker. And to take a quote from Douglas Adams in his guide for hitchhikers, and adjust it to our context, it would read: “A Google Core Algorithm Update is big. Really big. You just won’t believe how vastly [...]HUCKABUY'S COMMENT:HUCKABUY'S COMMENT: Within any Google update, your site will likely see changes. Before an update, Semrush, a prominent figure in the SEO industry, recommends...
- Forbes2021 Google Algorithm Update: Double Down On Website User ExperienceBy now, it should be no secret that website user experience (UX) ultimately determines whether a website sinks, floats or takes off. A Google algorithm update is in the process of rolling out projected to be complete by May, which is introducing new ranking signals . . .HUCKABUY'S COMMENT:HUCKABUY'S COMMENT: Forbes mentions the importance of the user experience when it comes to Google’s algorithm. It is ultimately what determines the success of...
- Search Engine RoundTableGoogle November 2021 Spam Update Rolling OutGoogle announced last night that is has begun rolling out a new algorithm update targeting search spam. The new update is named the November spam update and should take about a week to rollout fully. Google said on Twitter "as part of our regular work to improve . . .HUCKABUY'S COMMENTHUCKABUY'S COMMENT: This latest Google Algorithm Update, released over the first week of November, focuses on targeting spam content that fails to meet Google...
- Search Engine JournalGoogle Spam Update Done Rolling OutGoogle confirms an algorithm updated targeted at fighting spam has finished rolling out to search results.Huckabuy CommenGoogle finished rolling out their November Spam update on the 12th. This was the 4th spam update just this year. This update is in...
- The StarWhat is ‘MUM’, Google’s future algorithm for revolutionizing our web searches?Google is considering a new algorithm for answering complex questions. — AFP RelaxnewsGoogle hasn’t stopped tinkering with its search engine, looking to innovations and in particular an algorithm to transform searches for answers to complex questions. This new technology, which iHUCKABUY’S COMMENT:HUCKABUY’S COMMENT: Google searches are only continuing to get more and more complex. With this growing complexity, the search engine must adapt. In recent...
- ForbesCouncil Post: The Future Of Search: Evolving Algorithms And Voice SearchLike most digital marketers, I stay current with all Google’s major algorithm changes. I also do a lot of experimenting with various other digital marketing strategies. I’m often pleasantly surprised by the results. . . .HUCKABUY’S COMMENT:HUCKABUY’S COMMENT: Digital marketers are constantly concerned about how the Google algorithm will adjust their site’s performance on the search engine. This algorithm is...
- Built In BetaGoogle’s Next Algorithm Update Is All About Site Performancen May of 2020, Google announced that an update to the company’s search algorithm could be coming sometime in 2021. It didn’t make much of an impression for most people, but in one corner of the tech world, search engine optimization (SEO) professionals immediately . . .HUCKABUY’S COMMENT:HUCKABUY’S COMMENT: Google has 81% of the search engine market share on desktop and 94% on mobile, making their algorithm a priority for websites....
- The Future of CommerceThe future of SEO: Search, trends, content, Google algorithm updateThe future of SEO seemed pretty clear about a year ago… until the latest Google algorithm updates started rolling out in 2021.Throughout June and July of this year, Google has rolled out at least eight updates, the last of which have many SEOs pulling out . . .HUCKABUY’S COMMENT:HUCKABUY’S COMMENT: The Google algorithm is continuously changing. It is constantly learning from its users and what they value in a site. When the...
- Search Engine LandGoogle releases November 2021 spam updateGoogle is rolling out a new search ranking algorithm update targeting the more spammy side of of the search results. The company is calling this update the “November 2021 spam update.” It should take about a week to fully roll out.Huckabuy CommentThe November Spam update is complete. Google announced on Twitter on November 3rd, saying,"As part of our regular work to improve results, we’ve released...
- Rank RangerGoogle Algorithm Updates - Latest News & HistoryThroughout the year Google is constantly making updates to their algorithms, and that causes rank fluctuations in the search results. So far In 2019, Google has already rolled out several confirmed core algorithm updates.HUCKABUY'S COMMENT:HUCKABUY'S COMMENT: Rank Ranger tracks Google’s algorithm updates over the years and has recently cited new updates over the course of October 3rd and...
- Search Engine RoundtableHuge Google Search Ranking Algorithm Update On October 2nd & 3rdI know I sound like a broken record but yet again, we have another unconfirmed Google search ranking algorithm update over the weekend. This one is off the charts, huge, massive, and all those fun adjectives, according to the tracking tools. The weekend chatter is not matching upHUCKABUY'S COMMENT:HUCKABUY'S COMMENT: Search Engine RoundTable reports a significant Google ranking update earlier this month. Although unconfirmed by the search engine itself, the SEO community...
- SearchmetricsGoogle Core Update June/July 2021: All the info on Google’s Summer UpdatesGoogle has announced a two-part summer update. Google’s first Core Update for 2021 is on its way, but as their developers couldn’t manage it all in one go, this Core Update will be released in two parts. The June 2021 roll-out began on June 2, with the next instalment . . .HUCKABUY'S COMMENTHUCKABUY'S COMMENT: The Algorithm Update of 2021 was meant to take place over the month of June, but was ultimately split up over two...
- Search Engine LandCore Web Vitals: SEOs look back and shrug; Thursday's daily briefSince its announcement in May 2020, the page experience update generated much speculation among SEOs. This was because it made user experience more of a Google ranking factor than it had been before and because it was announced more than a year ahead of its rollout.Huckabuy CommentWhile many in the SEO community haven't seen a major impact on their organic search rankings since the Page Experience Algorithm Update, several SEO...
- The New York TimesGoogle Seeks to Break Vicious Cycle of Online SlanderIn response to Times articles, the search giant is changing its algorithm, part of a major shift in how Google polices harmful content.Huckabuy CommentIn June, Google made an update to try to prevent unverified online slander. While this goes against Google's overall philosophy, Google has shifted their...
- MonsterInsightsGoogle Ranking Factors for 2021 (10 Are Most Important)Did you know that there are over 200 Google ranking factors? Google is by far the most popular search engine on the planet. It dominates other search engines like Bing and Yahoo with over 5.14 billion searches taking place on Google each day. So, it’s no surprise that . . .HUCKABUY'S COMMENTHUCKABUY'S COMMENT: With Google’s ever changing updates, it's incredibly important to be aware of how these updates affect the search engine’s ranking factors. After...
- Search Engine JournalGoogle July 2021 Update is Over - What Happened?Google's July 2021 Core Update is over and the search marketing community experiences it differently depending on strategy . .HUCKABUY'S COMMENT:HUCKABUY'S COMMENT: On July 12th, Google announced that the rollout of their new algorithm update was complete. This update came with great changes to...
- Search Engine LandGoogle July 2021 core update is finished rolling outGoogle has confirmed that the July 2021 core update is now “effectively complete.” Google wrote on the Search Liaison Twitter account “the July 2021 core update rollout is now effectively complete.”HUCKAUBUY'S COMMENT:HUCKAUBUY'S COMMENT: The July update took place over a roll-out period of 12 days, from July 1st to July 12th. Websites felt the effects...
- www.debugbear.comOptimizing Core Web Vitals without improving site performanceThe Core Web Vitals are a set of user experience metrics that Google uses as part of it's search result rankings. But how easy is it to game them?I created a test page where the largest element is a 5 MB image. We get a high Largest Contentful Paint (LCP) value, as the image takeHuckabuy CommentStay informed. Stay clear of fake solutions. As more people and organizations are coming up with ways to hack core web vital metrics without...
- Semrush BlogAssessing the Aftermath of Google’s June 2021 Core UpdateAs the SEO community prepares for the Page Experience update, the summer of Google updates has already begun.HUCKABUY'S COMMENT:HUCKABUY'S COMMENT: Semrush highlights some of the most affected websites from the update this last summer. Industries, categories, and sizes of websites were all...
- Search Engine LandGoogle made 4,500 changes to search in 2020Google has updated the How Google Search Works website portal today and with that informed us that the search company made 4,500 “improvements” to search in 2020. “There have been 4,500 such improvements in 2020 alone,” the companyHUCKABUY'S COMMENT:HUCKABUY'S COMMENT: Google is constantly updating their algorithm throughout the year, every year. In 2020 alone, Google stated they made 4,500 updates to Google...
- seroundtable.comGoogle June 2021 Core Update Impact Now Being FeltAs you know, the Google June 2021 Core Update began rolling out at about 6:30pm ET on Wednesday, June 2, 2021 but the chatter within the industry was not at core update levels. Meaning, SEOs who track these changes didn't really say this was a big update and I still think that...HUCKABUY'S COMMENTHUCKABUY'S COMMENT: Most algorithm updates start chatter amongst the SEO community, however this last update’s impact was seen much more spread out than ever...
- ForbesGoogle SEO Updates For 2021: LCP, FCP, FID, CLS, Oh My!While it’s no secret that Google updates the engine’s search algorithm frequently, many of the changes themselves aren’t publicized. After all, the goal is to give consumers the best search results, not to help marketers to create shortcut search engine optimization (SEO) . . .HUCKABUY'S COMMENTHUCKABUY'S COMMENT: The Young Entrepreneur Council (YEC) writing for Forbes is another group of many to emphasize the impact of the Google Algorithm Update...
- Marie HaynesGoogle Algorithm Update History - Penguin, Panda and more - Marie HaynesThe following is a complete history of every Google algorithm change that was either confirmed by Google or suspected by those of us who do a lot of work helping sites that have seen traffic drops.Huckabuy CommentMarie Haynes keeps a historical record of what she calls "SERP Turbulence" in relation to various algorithm updates. Read this article to discover how...
- Search Engine Journal5 New Google Quality Rater Guidelines Updates & Why They MatterGoogle added 5 revisions to its Search Quality Raters Guidelines changelog. See what's new in YMYL content, 'lowest page quality,' and more.Lily RayOctober 19, 20216 min readVIP CONTRIBUTOR Lily RaySr. Director of SEO & Head of Organic Research at Amsive DigitalBioFollow / OcHuckabuy CommentWhile the Quality Rater Guidelines don't directly impact rankings and aren't a direct change to the ranking algorithm, the data/feedback coming from Google's Quality...
- TechCrunchGoogle refreshes its mobile search experienceGoogle announced today a subtle but welcome refresh of its mobile search experience. The idea here is to provide easier to read search results and a more modern look with a simpler, edge-to-edge design.From what we’ve seen so far, this is not a radically different look […]Huckabuy CommentGoogle made some slight design changes to their Search Results in January of 2021. The idea is to implement a more modern design style...
- seroundtable.comGoogle Rolling Out Continuous Scroll On Mobile Search ResultsGoogle announced yesterday that it is rolling out what they are calling "continuous scrolling" on the mobile search results. Google is not calling it infinite scroll, because the scroll does not infinitely scroll, it should stop after page four or so - but nevertheless there is aHuckabuy CommentGoogle announced a new update to mobile search results called that will change the way search engine users interact with SERPs on mobile devices....
- BacklinkoGoogle’s 200 Ranking Factors: The Complete List (2021)You might already know that Google uses over 200 ranking factors in their algorithm…But what are they, exactly? Well, you’re in for a treat because I’ve put together a complete list. Some are proven. Some are controversial.Google's algorithm ranking factors determine how your web page will be matched with a user search query, and where your page will be listed on a Google search results page. Site performance and page speed have long been factors in the PageRank system, and are only getting more important.Huckabuy Comment
- Search Engine JournalWordPress Proposes Performance Team For Core Web VitalsWordPress acknowledges losing ground to Wix, proposes a Performance Team. Says responsibility for speed belongs to WordPress not pluginsHuckabuy CommentWhile it's exciting that Wordpress taking steps to increase performance for Wordpress sites, their contributions will be limited since many websites need custom speed...
- The InformationGoogle Search Wants to Curate Big News. It Could Be a MinefieldGoogle is trying to learn a tough job that news editors around the world do everyday: curating information about breaking news.A small team inside Google’s search organization has spent more than a year developing a search engine feature called Big Moments that takes a more activHuckabuy CommentGoogle is trying to compete with other online sources of information, like Twitter, where people often find the latest news on things that are...
- Search Engine JournalGoogle FAQ Provides Core Web Vitals InsightsGoogle published a handy document sharing insights on how Core Web Vitals (CWV) works...Google recently published a document that provides insights into how CWVs work and their value for ranking purposes. This article discusses it.Huckabuy CommentJohn Mueller explained that while the relevance and quality of your web pages are still the most important factor in ranking, Core Web Vitals...
- Search Engine JournalState of SEO: The Top Opportunities & Risks for the Next 12 MonthsTake in our State of SEO report as we break down industry SWOT analysis based on 2,800+ responses from SEO professionals worldwide.Huckabuy CommentIf you want to succeed in SEO, you need to have the basics down, and 13.8% of the Search Engine Journal SEO community said...
- MangoolsWhat Is Google Algorithm And How It Works? | MangoolsGoogle search algorithm is a complex system that allows Google to find, rank and return the most relevant pages for a certain search query. To be precise, the whole ranking system consists of multiple algorithms that consider various factorsHuckabuy Comment:HUCKABUY COMMENT: Google Page Experience ranking factors are simply one factor in a long list of ranking factors in Google PageRank algorithm. Usability of...
- seroundtable.comGoogle Link Spam Update Took A Full Month To Roll OutGoogle announced that the link spam update that initially began rolling out on July 26, 2021 is now done rolling out as of August 24, 2021. That is over a full-month of rolling for that update and two-weeks longer than Google initially said.Here is Google's announcement...CommentHUCKABUY COMMENT: The recent: Link Spam Google update too over a month to rollout — but it's now live! What does that mean? The...
- Search Engine JournalCore Web Vitals Means Deciding What Add-ons are NecessaryGoogle's Martin Splitt encourages analysis of whether a plugin or add-on should be replaced if it can't be optimized for Core Web VitalsHuckabuy Comment:HUCKABUY COMMENT: Core Web Vitals have everything to do with how your user is experiencing page loading time. Add-ons and plugins can result in...
- seroundtable.comGoogle Search Ranking Update On Saturday - September 4th (Tools Little Chatter)This weekend there may have been yet another Google Search algorithm ranking update. This one is a bit different in that the chatter was pretty low, maybe that is because of the Labor Day weekend? But the tools, almost all of them, spiked higher than the September 1st updateCommentHUCKABUY COMMENT: There was some speculation in the SEO community about whether or not there was a Google algorithm update on September 4th. While...
- WordStreamThe 8 Biggest Google Algorithm Updates of 2021 (+Optimization Tips)Google is always evolving its algorithm to ensure it is surfacing the most accurate, relevant, and secure pages for its users. And each year, it seems to introduce more and more updates per year. Knowing what sort of updates have taken place will help you to stay in line with SEOPage Experience update was one of 8 in 2021HUCKABUY COMMENT: The page experience update was the most anticipated — and arguably the most impactful — update in 2021. This update was just...
- https://www.allbusiness.com/14 Most Annoying Reasons Why Your Google Ranking DropsSearch engine optimization can be a long process, with results only starting to appear after a few months of work....Huckabuy CommentHUCKABUY COMMENT: Your Google search rankings can drop for a variety of reasons, and it's necessary to consider all options before diagnosing a problem....
- seroundtable.comPossible Google Algorithm Update On September 16th & 17thWe may have had another Google search ranking algorithm update this past Thursday and Friday - over Yom Kippur day and Friday. The chatter was somewhat limited but there is chatter and the tools mostly show signs of a small update on the 16th and 17th of September...CommentHUCKABUY COMMENT: Barry Shwartz, a prominent name in the SEO space, reported on several instances of ranking fluctuation for various brands around 9/16 and...
- Search Engine JournalTop 8 Google Ranking Factors: What REALLY Matters for SEOWhich Google ranking factors matter most to your SEO strategy? Read about the ones that top our list and why.By https://www.searchenginejournal.com/author/anna-crowe/Ah, ranking factors. The ancient art of ranking in search engines is a lesson in balance and patience. Yet some people read an article like the example below that talks about the most important ranking factors and think, “Yep, I’ll follow that advice.”Why Page Experience is One of The Top Ranking FactorsHUCKABUY (LINDSEY) COMMENT: Anna Crowe argues that when it comes to ranking factors you should focus on quality over quantity. This is certainly sound...