What is the Google Page Experience report?
The Google Page Experience report shows the percentage of mobile URLs on your website with a “good” page experience, whether there are any page experience issues detected or “failing” URLs on your website, as well the number of impressions in organic search generated by those “good” URLs.
Why is this report important for search engine optimization?
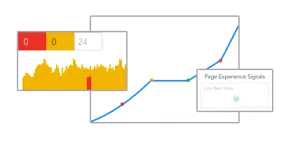
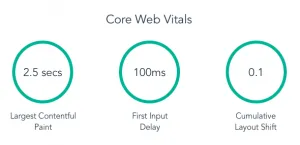
The current page experience rankings signals — mobile-friendliness, HTTPS/security, and advertising experience — are being joined by the new Core Web Vitals metrics: Largest Contentful Paint, First Input Delay, and Cumulative Layout Shift. This brand new report will track the quality of your site’s page experience based on these 6 metrics, the impact on your organic search channel, and identify opportunities at the URL level to improve page experience where issues are found.
How does the Page Experience Report work?
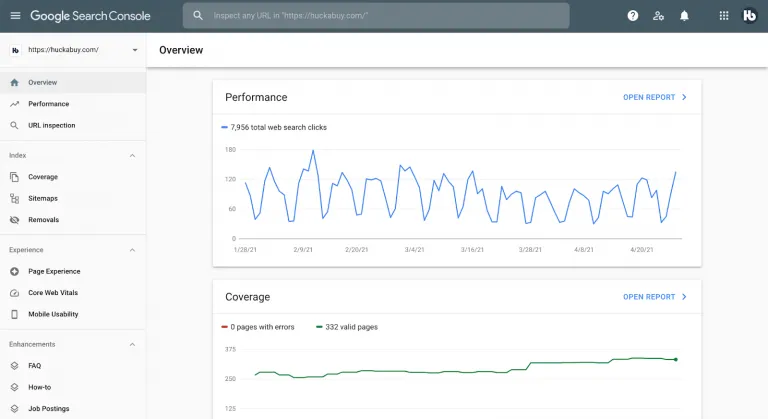
The Page Experience report can be found in your Google Search Console.
1.) In the left-hand rail on the main page nested under “Experience,” click on “Page Experience.”
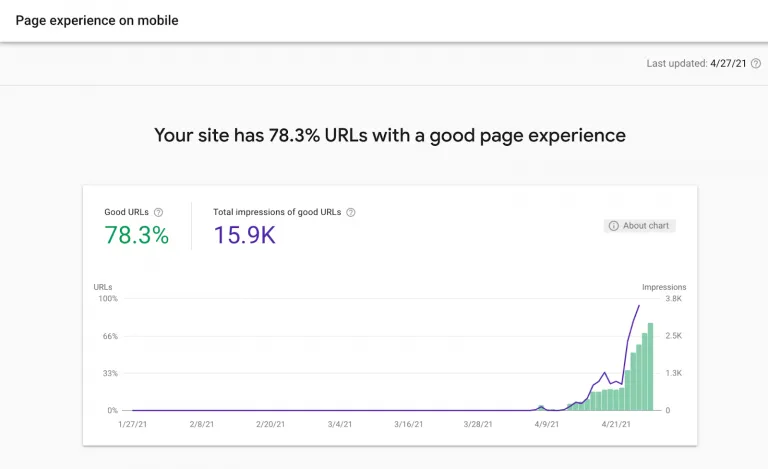
2.) The new page will display a headline showing the percentage of URLs with a “good” page experience, as well as a chart showing the estimated number of organic impressions generated by these URLs.
3.) Below this chart is a list of the 6 page experience signals: mobile-friendliness, HTTPS security, advertising experience, and the 3 Core Web Vitals.
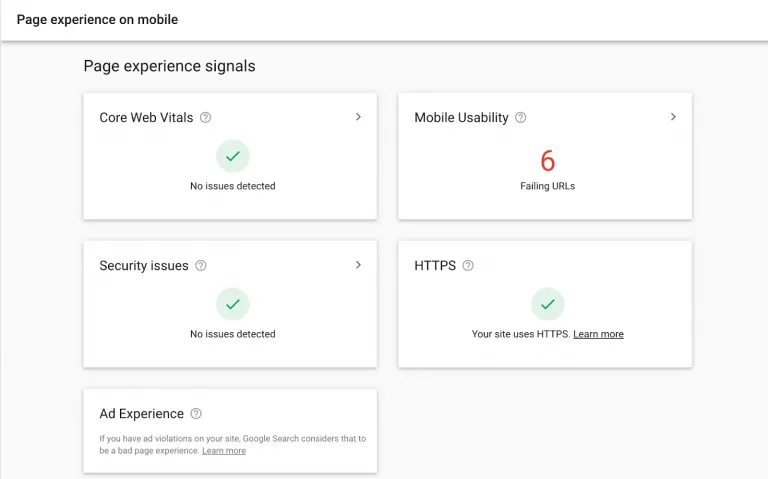
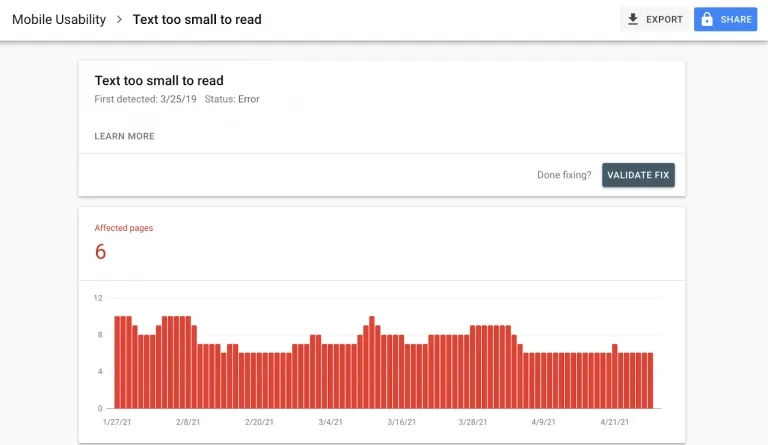
- Click into any of these reports to see the number of “good,” “needs improvement,” and “poor” URLs. You can click into each type for a more detailed description of any issues that may be affecting the URLs.
Note — because the upcoming Google “Page Experience” algorithm update only applies to the mobile versions of websites, this report only evaluates and reports on mobile URLs.
How does this report help you track Core Web Vitals?
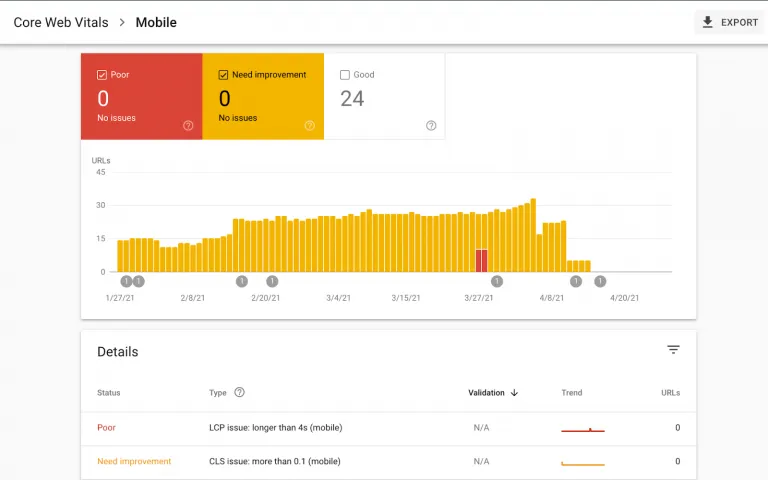
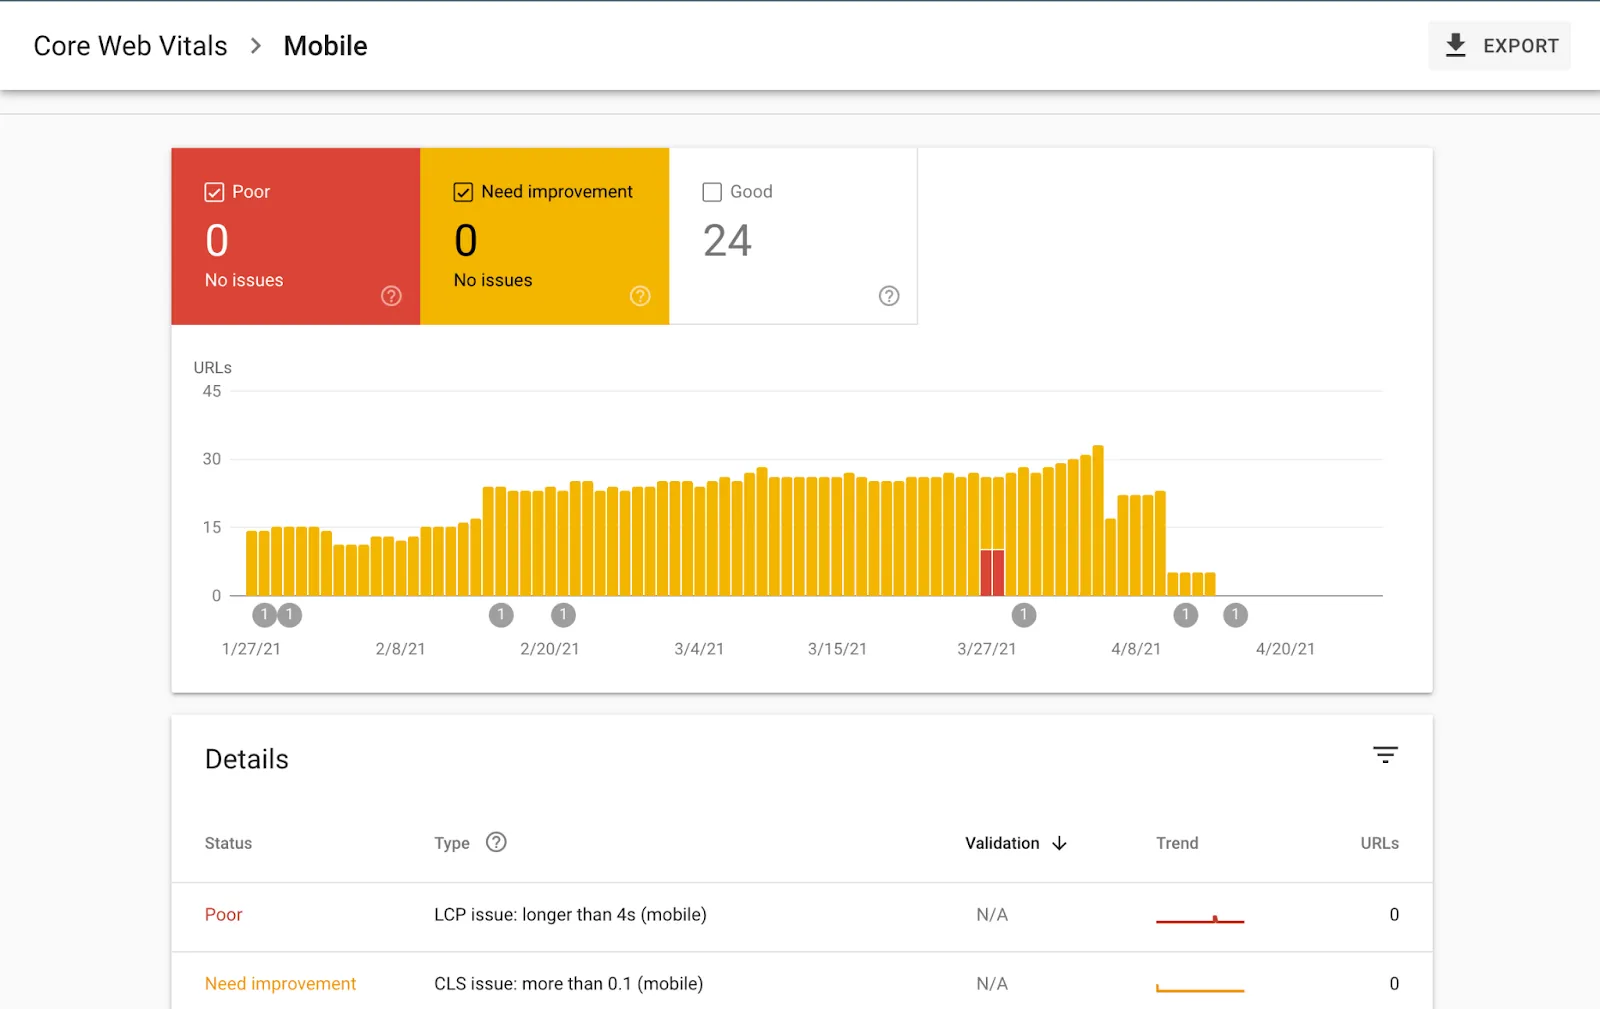
The three Core Web Vitals constitute only 3 of the 6 “page experience” ranking signals, which are all included in this comprehensive report.
To look specifically at and track Core Web Vitals data, simply click into that report. You will see a window that looks something like the one shown below. There will be numbers for each of the types of URLs: “good,” “needs improvement,” and “poor,” as well as a Details section showing the types of issues and the number of URLs affected by each issue type. You can click into each one to see a sample of affected URLs.
And that’s it! If you have any further questions about how to use this tool, don’t hesitate to contact our team by emailing support@huckabuy.com.