What is the Pagespeed Insights tool?
The Google Page Speed Insights tool analyzes the content of a web page, provides mobile and desktop scores based on Lighthouse data on a 0 to 100 scale, and generates recommendations to improve website performance and make the web page faster.
Why is this tool important for SEO and performance in general?
This tool helps you measure, monitor, and identify ways to improve the performance of your web pages. Page loading speed is an important part of search engine optimization. It’s been a Google ranking signal on desktop devices since 2010, on mobile devices since 2018, and it will be further expanded when the Core Web Vitals ranking signals go live in the summer of 2021.
How does this tool work?
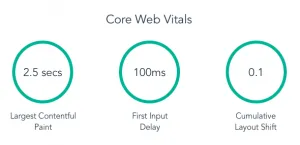
- This tool generates scores and associated reports based on lab data for your web page compiled by Google’s Lighthouse report. The lab data relies on six metrics: Total Blocking Time, Speed Index, First Contentful Paint, Time To Interactive, and two of the three Google “Core Web Vitals” — Largest Contentful Paint and Cumulative Layout Shift.
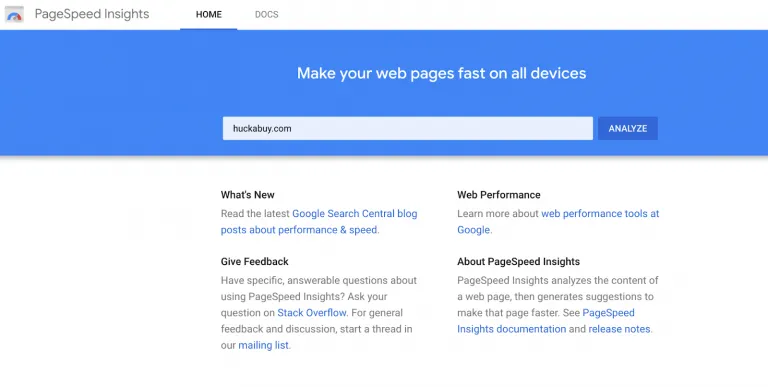
- Start by copy and pasting a URL from your website into the box in the middle of the screen and click “analyze.” After a few seconds, results will be returned for the mobile and desktop versions of the page.
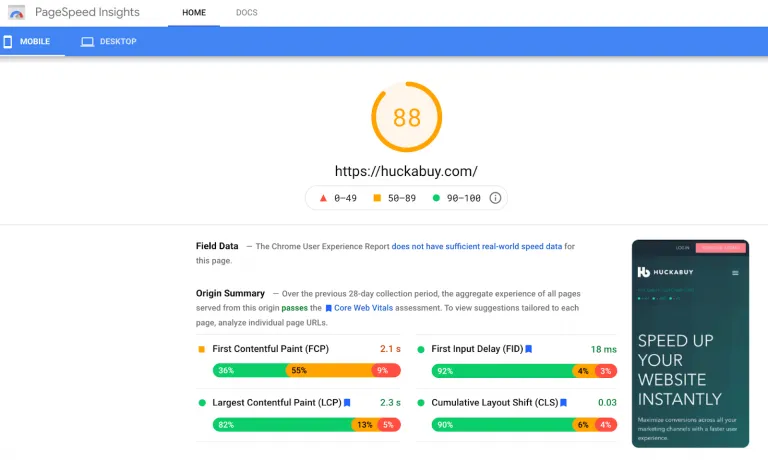
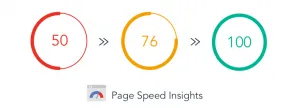
- There is a score given for each version of the page. Any score falling under 49/100 is considered “poor.” Any score falling between 50/100 and 89/100 is considered “in need of improvement.” And any score falling between 90/100 and 100/100 is considered “good.”
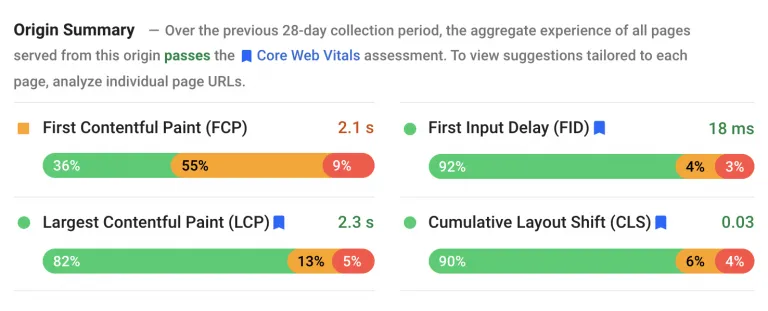
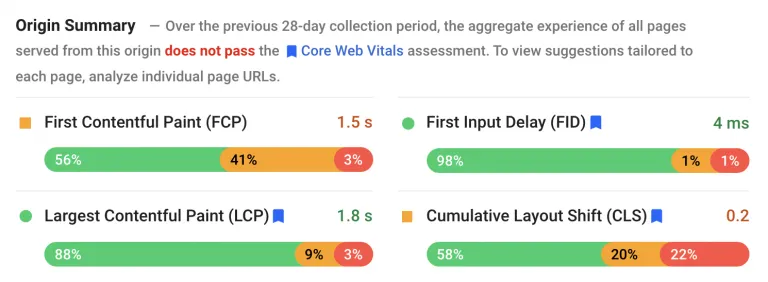
- Scroll down below this section to see the “Origin Summary,” which tells you whether the page is passing the Core Web Vitals assessment based on data aggregated from the trailing 28 days. Numbers for each of the Core Web Vitals, in addition to First Contentful Paint, are displayed to explain the result.
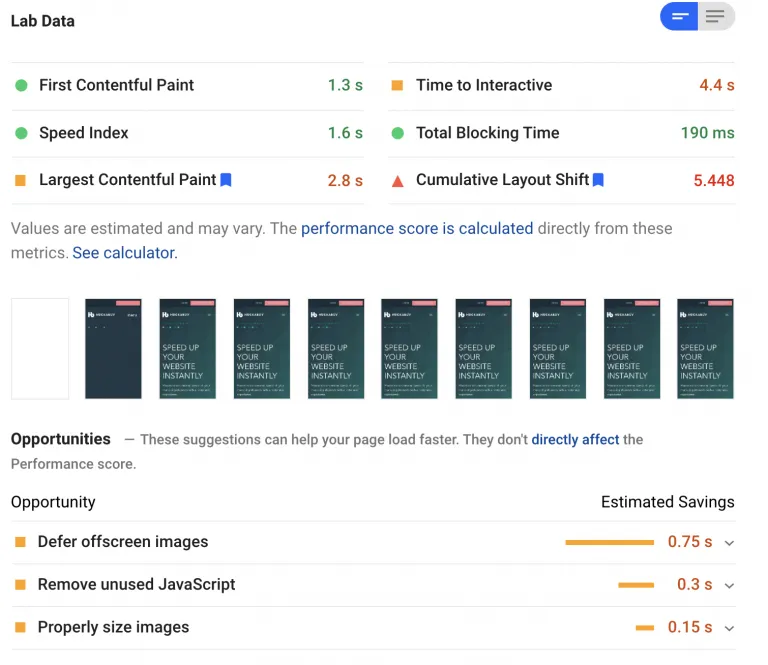
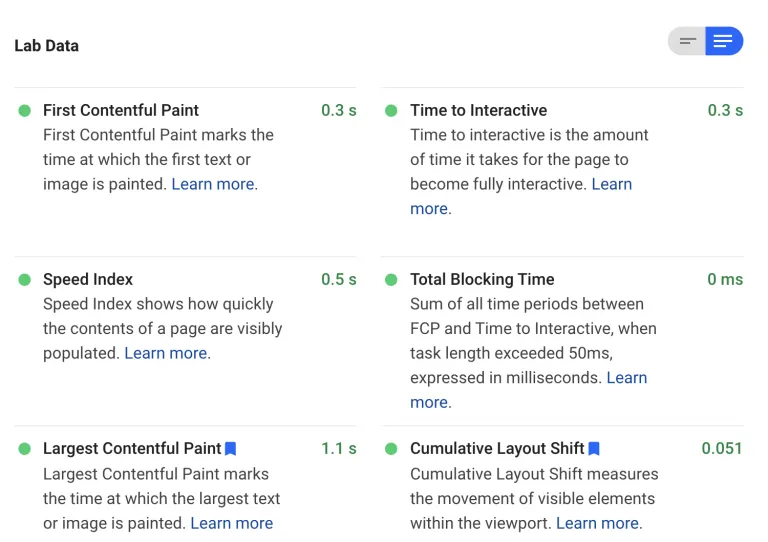
- Scroll down further to see the “Lab Data” section, which provides the numbers and definitions for each of the six Lighthouse metrics that determine your overall page speed score from this tool.
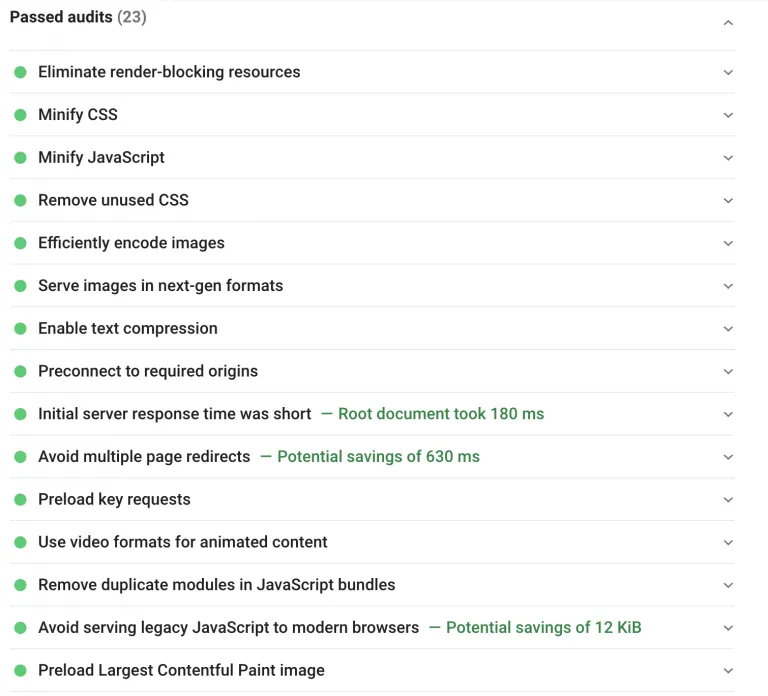
- Scroll down further once again to see the sections on “Opportunities,” “Diagnostics,” and “Passed Audits.” These sections communicate what you are doing well from a performance standpoint, as well as what you could be doing better to improve your scores.
How does this tool help you track Core Web Vitals?
View All Core Web Vitals in the Origin Summary Section
In the Origin Summary section, each of the three Core Web Vitals and their accompanying scores are shown front and center. Additionally, the tool communicates whether the page is passing or failing the Core Web Vitals assessment.
View Two of the Three Core Web Vitals in the Lab Data Section
In the Lab Data section, two of the three Core Web Vitals (Largest Contentful Paint and Cumulative Layout Shift) are shown, as well as Total Blocking Time, which is the lab data equivalent for the third metric, First Input Delay. You can see the individual scores here as well, in addition to explanations for each of the metrics.
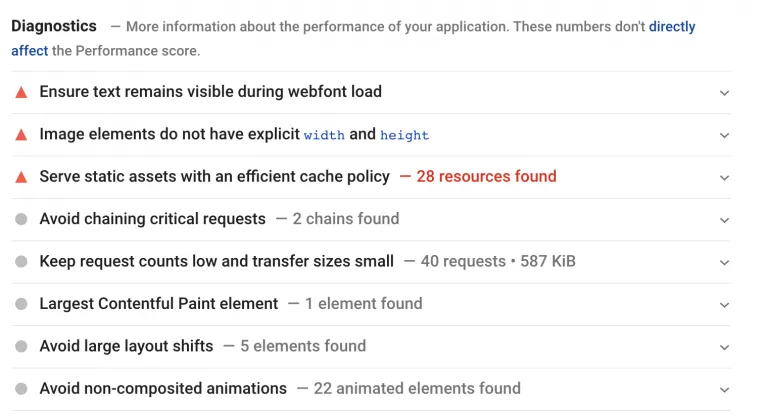
Recommendations on How to Improve Core Web Vitals Found In the Diagnostics Section
In the Diagnostics section, you can find recommendations to directly improve each of the three Core Web Vitals. In the image below, for example, you can see a few recommendations to improve Largest Contentful Paint and Cumulative Layout Shift. Clicking on the carrot in each will show the specific steps you can take on each action item.
And that’s it! If you have any further questions about how to use this tool, don’t hesitate to contact our team by emailing support@huckabuy.com.