What is the Google Crawl Stats Report?
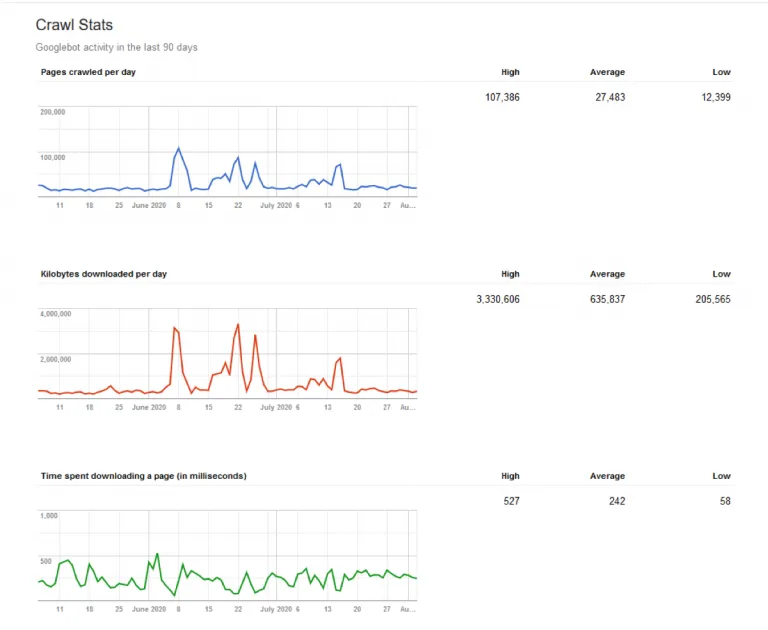
The new Google Crawl Stats Report — released in November 2020 — helps developers, webmasters, and SEOs understand Google’s crawling experience on their websites. It is a major upgrade over the previous report, which only showed three metrics in isolation: pages crawled per day, data downloaded per day, and time spent downloading pages per day.
The new version looks more like the rest of Google Search Console and there is a lot of critical information for technical SEO here. The report provides in-depth data on how Google crawls your site, how your site reacts to any given crawl, and its overall technical health of your site — as well as advice on how to debug any associated issues.
Where do I find the crawl stats report?
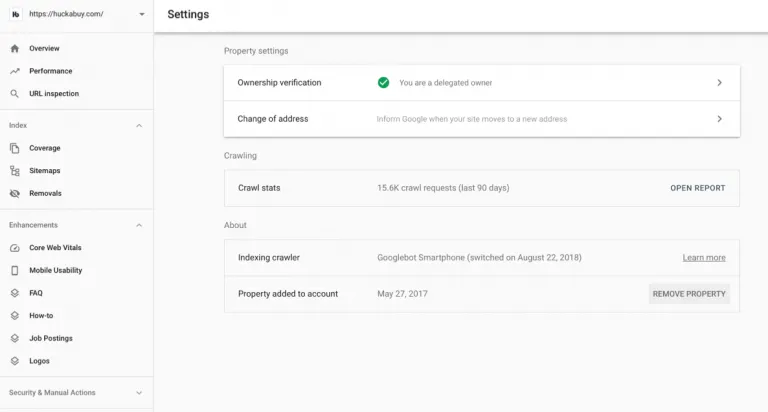
To access the new Google Crawl Stats report, you need Search Console and access to the property. Click into the property. On the left-hand rail under property settings, click on “crawl stats” to open the report.
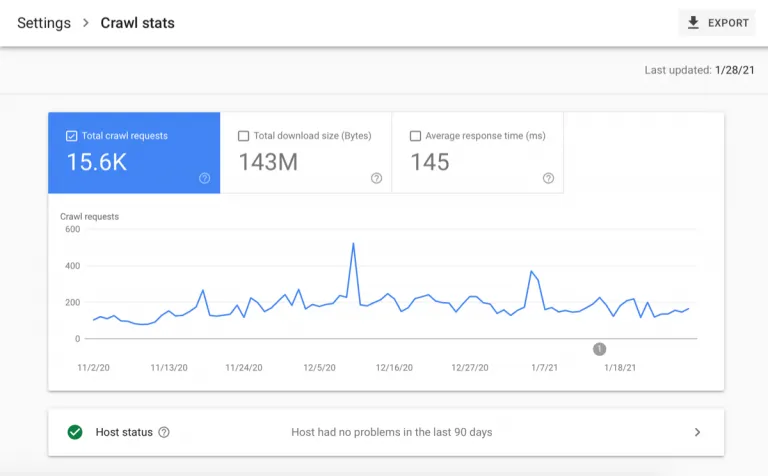
You will see a window for crawl history over the last 30 days which reports on metrics like total crawl requests, total download size, and average response time for requested URLs. There will be another window for host status issues associated with your robots.txt file, DNS resolution, and server connectivity. And you will also see a window for crawl breakdown by the response, file type, purpose, and agent type.
What does the Search Console Crawl Stats Report measure?
The crawl stats report measures how bots interact with your site. At the top of this report — above the fold — you have a graph and 3 metrics shown: total crawl requests, total download size, and time spent downloading a page.
Here is a break down of the various crawl stats metrics:
Total Crawl Requests
Total crawl requests measures the total number of crawls for URLs on your site in a given time period to indicate how frequently Google is crawling your site. These include both successful and unsuccessful crawl requests. An unsuccessful request might result from DNS issues, server connectivity issues, redirect loop issues, or fetches never made because of an unavailable robots.txt file.
Total Download Size
Total dowload size is a metric that reflects how much content Google is downloading during its crawling process in the given time period. If you have high averages, Google is crawling your site often and downloading a lot of content. However, those high averages could also mean Google is taking too long to crawl your site. That said, good average response times, would offset this issue as they are a good indication of a site that is efficient to crawl.
Average Response Time
Average response time tells you how long it takes for a search engine to request page content. The lower the number, the less time Google is spending on your site and thus, crawling and indexing at a faster rate. To improve this number, there are a number of optimizations that can be made. For example, you can block unnecessary pages from being crawled by modifying your robots.txt file, or cutting bloated content or code.
Host Status
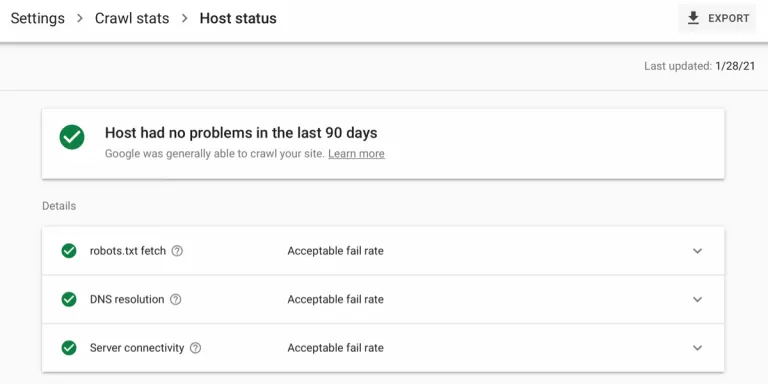
There is also a host status section that shows whether Google encountered any availability issues with your robots.txt file, DNS resolution, or server connectivity while attempting to crawl the site in the last 90 days. For each of these points, it will indicate whether your site has had an “acceptable fail rate,” an “acceptable fail rate recently, but high in the past,” or “a high fail-rate in the last week.” You can inspect the response tables to see what the specific problems are — if there are any.
Solving Host Status Issues
Here are some courses of action you can take for robots.txt files, DNS resolutions and server connectivity:
- With the robots.txt file, make sure the request returns a valid file, or else Google will slow or stop crawling your site entirely until it gets an acceptable response.
- With DNS resolution, check your registrar to make sure the site is correctly set up and connected to the internet so that Google recognizes the hostname and it responds to crawling.
- With server connectivity, in particular, look to see whether you are appropriately controlling the crawling and indexing of your site via the robots.txt and whether you need to increase your site’s ability to handle the traffic.
Crawl Requests Breakdown
Below the fold, there is a crawl requests breakdown by response, file type, purpose, and Googlebot type. Click into any of these grouped Data Type Entries to see a list of example URLs for that type.
Crawl Responses
Crawl responses show the responses that Google receives when crawling your site. They are grouped together by code (like 200, 301, 302, 404, and 5xx) and given a percentage to represent how much of the crawl budget was used on them. It is critical to determine here what percentage of your crawl budget is used on non-200 responses and to make changes accordingly
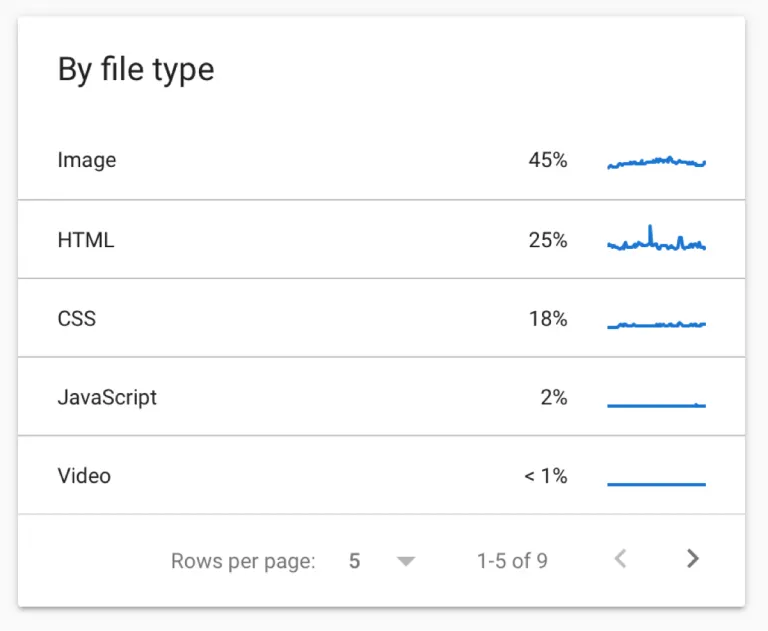
File Type
File type shows the percentages of crawl budget used on various types of files like HTML, Javascript, CSS, image, video, and audio to name a few. Understanding how frequently Google requests specific types of resources like Javascript and CSS can better inform a number of different technical SEO strategies, like the type of rendering you want to use on your site.
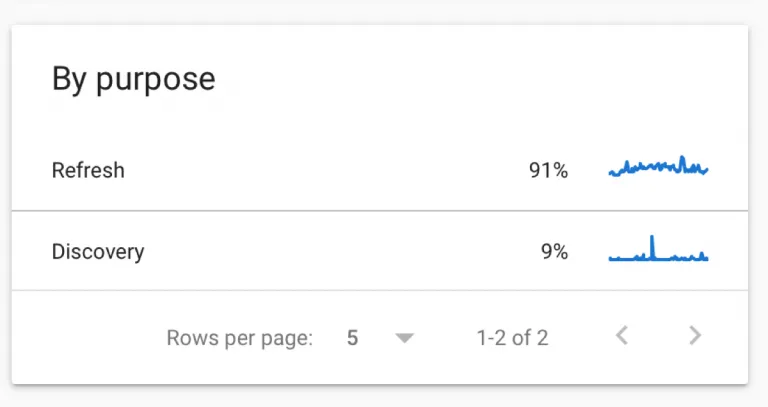
Crawl Purpose
Crawl purpose indicates whether Google is requesting a URL they have never crawled before (discovering new content) or returning to a known page looking for refreshed content. If you have recently added a lot of new content or submitted a new sitemap, you will likely see an increase in “discovery” crawls in this breakdown. If you have pages with rapidly changing content, you will likely see larger percentages of “refresh” crawls in this breakdown. Understanding the purpose behind a crawl and seeing example URLs included can help you drill down into what pages are receiving priority and whether you need to fix any issues in your sitemap, robots.txt file, or internal linking system to help Google access important content.
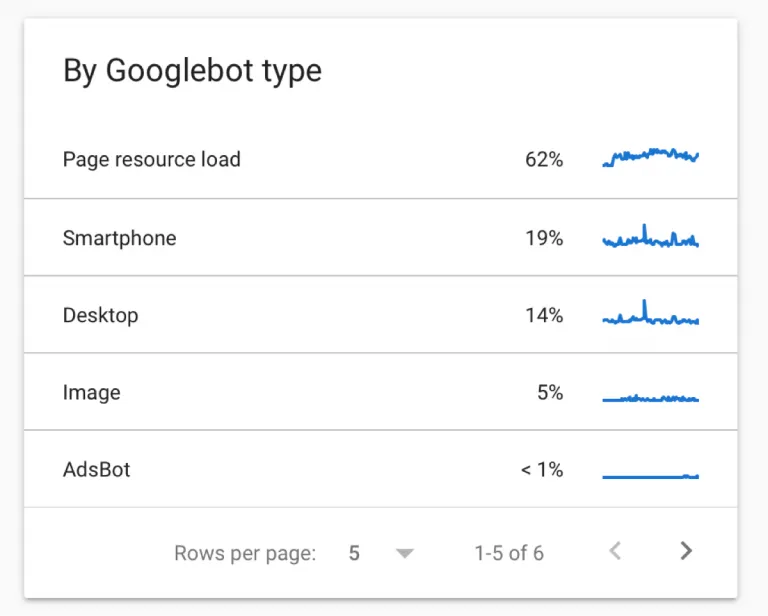
Googlebot Type
Googlebot Type shows which types of crawlers — mobile, desktop, image, video, page resource load, adbot, storebot, etc — are accessing your site and how often they are doing so. It depends on the site, but the majority of crawls will likely come from the mobile or desktop bot to simulate user experience on those devices.
How can I use the Google crawl stats report for SEO?
This Google Search Console Crawl Stats report is a big help for technical SEO, which of course deals heavily with crawling and indexing of the website. If Google can’t properly crawl your site, they will not be able to index new pages or detect changes to old pages and consider the content for ranking purposes. So this new report gives actionable data to use when debugging crawling and general site performance issues. The report also makes it way easier now to diagnose hosting problems, resources eating up too much crawl budget, 404 errors, and the like. You are more clearly seeing your website from Google’s point of view. With this data on how they crawl our site and how our site responds, we can make more effective, more informed optimizations.
Here are some example use cases:
- With the metric on status codes returned, you can determine what percentage of your crawl budget is used on redirects, missing pages, and error responses.
- With the metric on file types, you can determine how frequently and to what extent Google is requesting CSS, JS, and image files.
- With the metric on crawl purpose, you can determine how often they are crawling to discover new content or refresh old content.
In general, it is also an accessible and easy report to read — particularly if you don’t have a technical background or access to your log files. Every section breaks down — sometimes even in color-coding — what is working well, what needs to be addressed, and why with best practices and tips included.
Conclusion
How does this report stack up to traditional log file analysis? The big differentiator is that you can now determine the purpose of each Google visit to your site. That’s not possible to glean from log files. And as we have already covered, this report is a massive upgrade over the old one. But there are shortcomings. First and foremost, this report still only records Google’s activity on your site. Furthermore, you are just receiving a sample of crawled URLs — not the full list. And then there are other issues — like the fact that you can’t toggle the date range for historical numbers, drill down on geographical regions, or access information via API yet. So log file analysis is still important. Log files record every request to your site, like crawling activity from Bing for example. And the data is also more accurate in the moment — sometimes 20-40% more accurate, as Google’s data can lag up to a week. So consider this report a valuable, but still limited, tool in your technical SEO kit.
For information on how to automatically action technical recommendations from this crawl stats report, check out our software platform, Huckabuy Cloud.